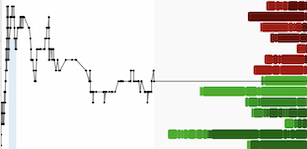
The euro/yen (RY) cross turned down at resistance. The prior failures came in December 2014. The Chinese yuan would devalue in August 2015 and commodities would bottom in early 2016, with interest rates reaching their nadir after the Brexit vote in June 2016. Then came the turn in February 2018. Volmaggedon took place that month. Tech stocks would lead a general market correction that started in October 2018.
Here we are again. The third chart shows the inverse, yen/euro, along with the US Dollar Index (DXY). Longer term, the chart could still resolve in either direction, but short-term it lends weight to those traders looking for a rebound in the US dollar.


