


TORONTO, Feb. 20, 2024 (GLOBE NEWSWIRE) -- Discovery Silver Corp. (TSX: DSV, OTCQX: DSVSF) (“Discovery” or the “Company”) is pleased to announce results from the Feasibility Study (“FS” or “the Study”) on its 100%-owned Cordero silver project (“Cordero” or “the Project”) located in Chihuahua State, Mexico. Highlights include (all figures are in US$ unless otherwise noted):
- Large-scale, long-life production: 19-year mine life with average annual production of 37 Moz AgEq in Year 1 to Year 12.
- Low costs, high margins & low capital intensity: average AISC of less than $12.50 over the first eight years of the mine life placing Cordero in the bottom half of the cost curve.
- Low capital intensity: initial development capex of $606 million resulting in an attractive after-tax NPV-to-capex ratio of 2.0.
- Attractive project economics: Base Case after-tax NPV5% (“NPV”) of $1.2 billion and IRR of 22% with NPV expanding to $2.2 billion in Year 4.
- Tier 1 reserve base: Reserves of Ag - 302 Moz, Au - 840 koz, Pb – 3.0 Blb and Zn – 5.2 Blb, positioning Cordero as one of the largest undeveloped silver deposits globally.
- Clear upside potential: 240Mt of Measured & Indicated Resource sit outside the FS pit highlighting the potential to materially extend the mine life at modestly higher silver prices.
- Substantial socio-economic contribution: an initial investment of over $600 million, 2,500 jobs created during construction, $4 billion of goods and services purchased and estimated tax contributions of over $1.4 billion within Mexico.
- Industry-leading environmental standards: third-party reviews of proposed environmental practices to ensure adherence to both Mexican regulatory standards and Equator Principles 4. The Study also incorporates investment in infrastructure and technology to recycle wastewater from local communities with discharged water representing the primary source of water for mine operations.
Tony Makuch, CEO, states: “Our Feasibility Study has delivered outstanding results that clearly establish Cordero as one of the world’s leading development-stage projects. Cordero is the largest undeveloped silver project globally based on both reserves and annual production and has low unit costs in support of high margins and substantial cash flow generation. Cordero is also extremely capital efficient, with an initial NPV to Capex ratio of 2.0x, with the NPV almost doubling to over $2 billion by year four following completion of the Phase 2 mill expansion that is primarily funded by internal cash flow. With more than 300 Moz of silver reserves, a mine life of close to 20 years and significant extension potential, Cordero is uniquely positioned to play a key role in closing market deficits in the silver space and in supplying future consumption in high-growth areas including the battery vehicle and solar power sectors.
“Importantly, Cordero will have a major positive socio-economic impact locally in Parral, in the Chihuahua region and at the national level. Cordero will create up to 2,500 jobs during the construction period, 1,000 direct jobs over the mine life, will purchase in excess of $4 billion of goods and services from local and regional suppliers, and will generate $1.4 billion of tax revenues at all levels of government. As part of our proactive approach to water management, we also plan to invest in infrastructure and technology that will support recycling of wastewater produced from local communities for use as our primary source of water for the Project. Our team in Mexico has already won numerous awards for social responsibility, environmental protection and workplace culture and we look forward to expanding on these efforts as part of our commitment to the sustainable development of Cordero and our adherence to the highest industry standards for environmental protection, water management, social responsibility and health and safety.”
The Company will be hosting a Conference Call to present the FS results on Tuesday February 20, 2024, at 11:00am ET. A presentation by management will be followed by Q&A. The webcast can be accessed at the following link: Webcast Link
FEASIBILITY STUDY SUMMARY
Project Economics
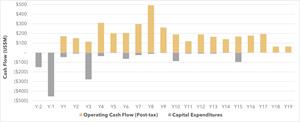
The economics for the FS were based on the following metal prices: Ag - $22.00/oz, Au - $1,600/oz, Pb - $1.00/lb and Zn - $1.20/lb. A 10% increase in metal prices results in a 40% increase in the Project NPV to over $1.6 billion. The payback is 5.2 years due to the expansion of the processing plant from 26,000 tpd to 51,000 tpd in Year 3 at a capital cost of $291 million. This expansion will be funded from operating cash flow. Completion of the expansion in Year 3 results in a peak Project NPV of $2.2 billion in Year 4.
| Units | Base Case | Base Case Metal Prices +10% | Base Case Metal Prices -10% | |
| After-Tax NPV (5% discount rate) | (US$ M) | $1,177 | $1,647 | $707 |
| Internal Rate of Return | (%) | 22.0% | 27.2% | 16.1% |
| Payback | (yrs) | 5.2 | 4.3 | 6.5 |
Note – refer to Appendix C for a more detailed sensitivity analysis.
Production & Costs
Annual production over the life-of-mine (“LOM”) is expected to average 33 Moz AgEq. In Years 5 – Year 12 production averages more than 40 Moz AgEq with peak production in Year 8 of 64 Moz AgEq. These production levels position Cordero as one of the largest primary silver mines globally. All-In Sustaining Costs (“AISC”) average less than $13.50/oz AgEq over the LOM. These costs were effectively flat in comparison to the PFS due to cost inflationary pressures being offset by improved silver payabilities and reagent cost reductions.
| Units | Year 1 – 4 (Phase 1) | Year 5 – 12 (Phase 2) | Year 13 -19 (Phase 2) | LOM | |
| AgEq Produced – Average/yr1 | (Moz) | 29 | 40 | 28 | 33 |
| AgEq Payable – Average/yr | (Moz) | 26 | 35 | 24 | 29 |
| AgEq Produced - Total | (Moz) | 116 | 323 | 196 | 635 |
| AgEq Payable - Total | (Moz) | 102 | 279 | 169 | 550 |
| All-In Sustaining Cost (AISC)2 | (US$/AgEq oz) | $13.22 | $13.01 | $14.36 | $13.47 |
- AgEq Produced is metal recovered in concentrate. AgEq Payable is metal payable from concentrate and incorporates metal payment terms outlined in the Concentrate Terms section below. AgEq is calculated as Ag + (Au x 72.7) + (Pb x 45.5) + (Zn x 54.6); these factors are based on metal prices of Ag - $22/oz, Au - $1,600/oz, Pb - $1.00/lb and Zn - $1.20/lb.
- AISC is a non-GAAP measure; refer to the Non-GAAP Measures section of the release for further information on this measure. See Technical Disclosure section for AISC calculation methodology.
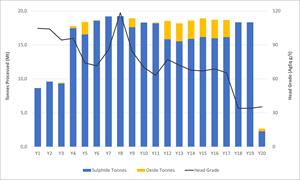
LOM Production

Note – Au/Pb/Zn production is shown on an AgEq basis based on: Ag = $22/oz, Au = $1,600/oz, Pb = $1.00/lb and Zn = $1.20/lb
Study Project Team
The FS was supported by a high-quality project team consisting of the following groups:
- Study lead: Ausenco Engineering Canada ULC (“Ausenco”)
- Metallurgical testwork: Blue Coast Research under the supervision of Libertas Metallurgy Ltd, Sacanus Holdings and Ausenco
- Resource estimation: RedDot 3D Inc. in conjunction with RockRidge Consulting and third-party review by Hardrock Consulting, LLC
- Process & infrastructure design: Ausenco and M3 Mexicana S. de R.L de C.V.
- Mine planning & costing – AGP Mining Consultants Inc. with third-party review by Hard Rock Consulting LLC
- Tailings design, hydrogeology and geotechnical – WSP USA Inc.
- Environmental: Ausenco, Investigacion Y Desarrollo De Acuiferos Y Ambiente and CIMA Consultores Ambientales
Next Steps
The following work is planned for 2024 with the objective of reaching a construction decision later this year or early 2025.
- Front-end Engineering Design (“FEED”): FEED engineering work consists of early project planning and advancement of engineering definition and will enable the Company to place orders for long lead-time items and to award the EPC/EPCM contract for the development of the Project.
- Permitting: the Company formally submitted for evaluation its Environmental Impact Assessment (“Manifestacion de Impacto Ambiental” or “MIA”) in August 2023. The review process for the MIA submission by Secretaría de Medio Ambiente y Recursos Naturales (“SEMARNAT”) is ongoing. The other principal permit required for construction and operation of Cordero is the Change of Land Use (“Cambio de Uso de Suelo” or “CUS”). Formal submission of the CUS is expected to be made by the third quarter of 2024.
- Project financing: the Company plans to progress all financing options for the Project through the course of 2024. These options include equity, debt, offtake, joint ventures, partnerships, lease financing on major equipment, streams, royalties and other strategic alternatives.
- Water management: a scoping study was completed for the FS to upgrade local water treatment plants in the region and for the construction of a water pipeline to site. Further engineering work on the plant upgrade is expected to be completed through the course of the year.
- Key de-risking items: the Company also plans to advance during the year the acquisition and leasing of surface rights where appropriate and permitting for the land, power and water required for the development and operation of Cordero.
Further details on the Company’s 2024 work program can be found in the news release dated January 24, 2024, and filed under the Company’s profile on www.sedarplus.ca.
Resource Update
In conjunction with the FS, the Mineral Resource Estimate for Cordero has been updated to incorporate an additional 33,400 m of drilling (total drilling of 310,900 m in 793 drill holes). The Measured & Indicated Resource has grown by 70 Moz AgEq to 1,202 Moz AgEq with the Inferred Resource being reduced by 12 Moz AgEq to 155 Moz AgEq as summarized below. The overall expansion of the resource was largely driven by exploration success at depth and in the northeast part of the deposit.
- Measured & Indicated Resource of 1,202 Moz AgEq at an average grade of 52 g/t AgEq (719 Mt grading 21 g/t Ag, 0.06 g/t Au, 0.31% Pb and 0.60% Zn)
- Inferred Resource of 155 Moz AgEq at an average grade of 32 g/t AgEq (149 Mt grading 14 g/t Ag, 0.03 g/t Au, 0.18% Pb and 0.35% Zn)
Mineral resources that are not mineral reserves do not have demonstrated economic viability. Further details on the Resource including all supporting technical disclosure are outlined in Appendix A.
CAPITAL EXPENDITURES
Cordero is a very capital-efficient project due to numerous underlying advantages:
- Staged expansion of the process plant
- Simple and conventional process design
- Minimal earthworks due to gentle topography, the location of bedrock near-surface and favourable geotechnical characteristics of the bedrock
- Minimal early mine development and pre-stripping resulting from the deposit extending to surface
- Close proximity to existing infrastructure including nearby highway and adjacent powerline
- Favourable mining jurisdiction with access to a highly skilled local workforce and no need for a camp given the proximity of the town of Parral approximately 40 km to the south
Initial Capital (to achieve plant throughput of 9.6 Mt/a)
Initial capital to build Cordero Phase 1 is estimated to total $606 million and will be incurred over a two-year construction period. This capital estimate includes Phase 1 of the process plant with nameplate capacity of 9.6 Mt/a (~26,000 tpd), the construction of on-site infrastructure, a power transmission line, the upgrade of the local water treatment plant and water pipeline, all pre-stripping activities and construction of the TSF starter dam that will provide 3 years of initial tailings storage.
Contingency for the initial capital estimate averages 12% and is applied to direct and indirect costs. Owners costs represent 2.3% of direct costs. Indirect costs represent 16% of direct costs. These proportions are in-line with typical industry averages and are consistent with a cost base for a greenfield project build in Mexico and commensurate with the level of complexity of the project build.
Expansion Capital (to expand plant to 19.2 Mt/a)
The processing facility will be expanded to a nameplate capacity of 19.2 Mt/a (~51,000 tpd) at an estimated cost of $291 million. Most of the costs associated with the expansion will be incurred in Year 3. The expansion includes the addition of parallel grinding and flotation circuits, additional on-site infrastructure and a tailings dam lift that is concurrent with plant expansion.
An expansion of the flotation circuit is planned for Year 7 at a cost of $17 million to accommodate an increase in zinc grades.
Sustaining Capital
Sustaining capital over the LOM totals $388 million (excluding closure costs net of salvage). This includes $221 million to be spent on tailings management facility expansions with the remainder to be spent on mine equipment, the process plant, mobile equipment and replacements/refurbishments of infrastructure assets. Sustaining capital for the process plant has been classified as operating costs under the maintenance category. Sustaining capital for mining only includes down payments on replacement equipment with the remaining lease costs classified as mine operating costs.
| DESCRIPTION (all in US$ millions) | INITIAL CAPITAL | EXPANSION CAPITAL | SUSTAINING LOM CAPEX | TOTAL LOM CAPEX | |
| CAPITAL EXPENDITURES | |||||
| Mining | $117 | $2 | $110 | $229 | |
| Onsite Infrastructure | $44 | $14 | - | $57 | |
| Processing Plant | $210 | $148 | - | $359 | |
| Tailings Facility (TSF) | $28 | $60 | $221 | $310 | |
| Offsite Infrastructure | $57 | - | $16 | $73 | |
| Indirects | $73 | $44 | $11 | $128 | |
| Owners Costs | $11 | $4 | - | $14 | |
| Contingency | $65 | $37 | $31 | $133 | |
| Closure costs / Salvage value | - | - | $75 | $75 | |
| Capital Expenditures - Subtotals | $606 | $309 | $463 | $1,377 | |
OPERATIONS
Mining
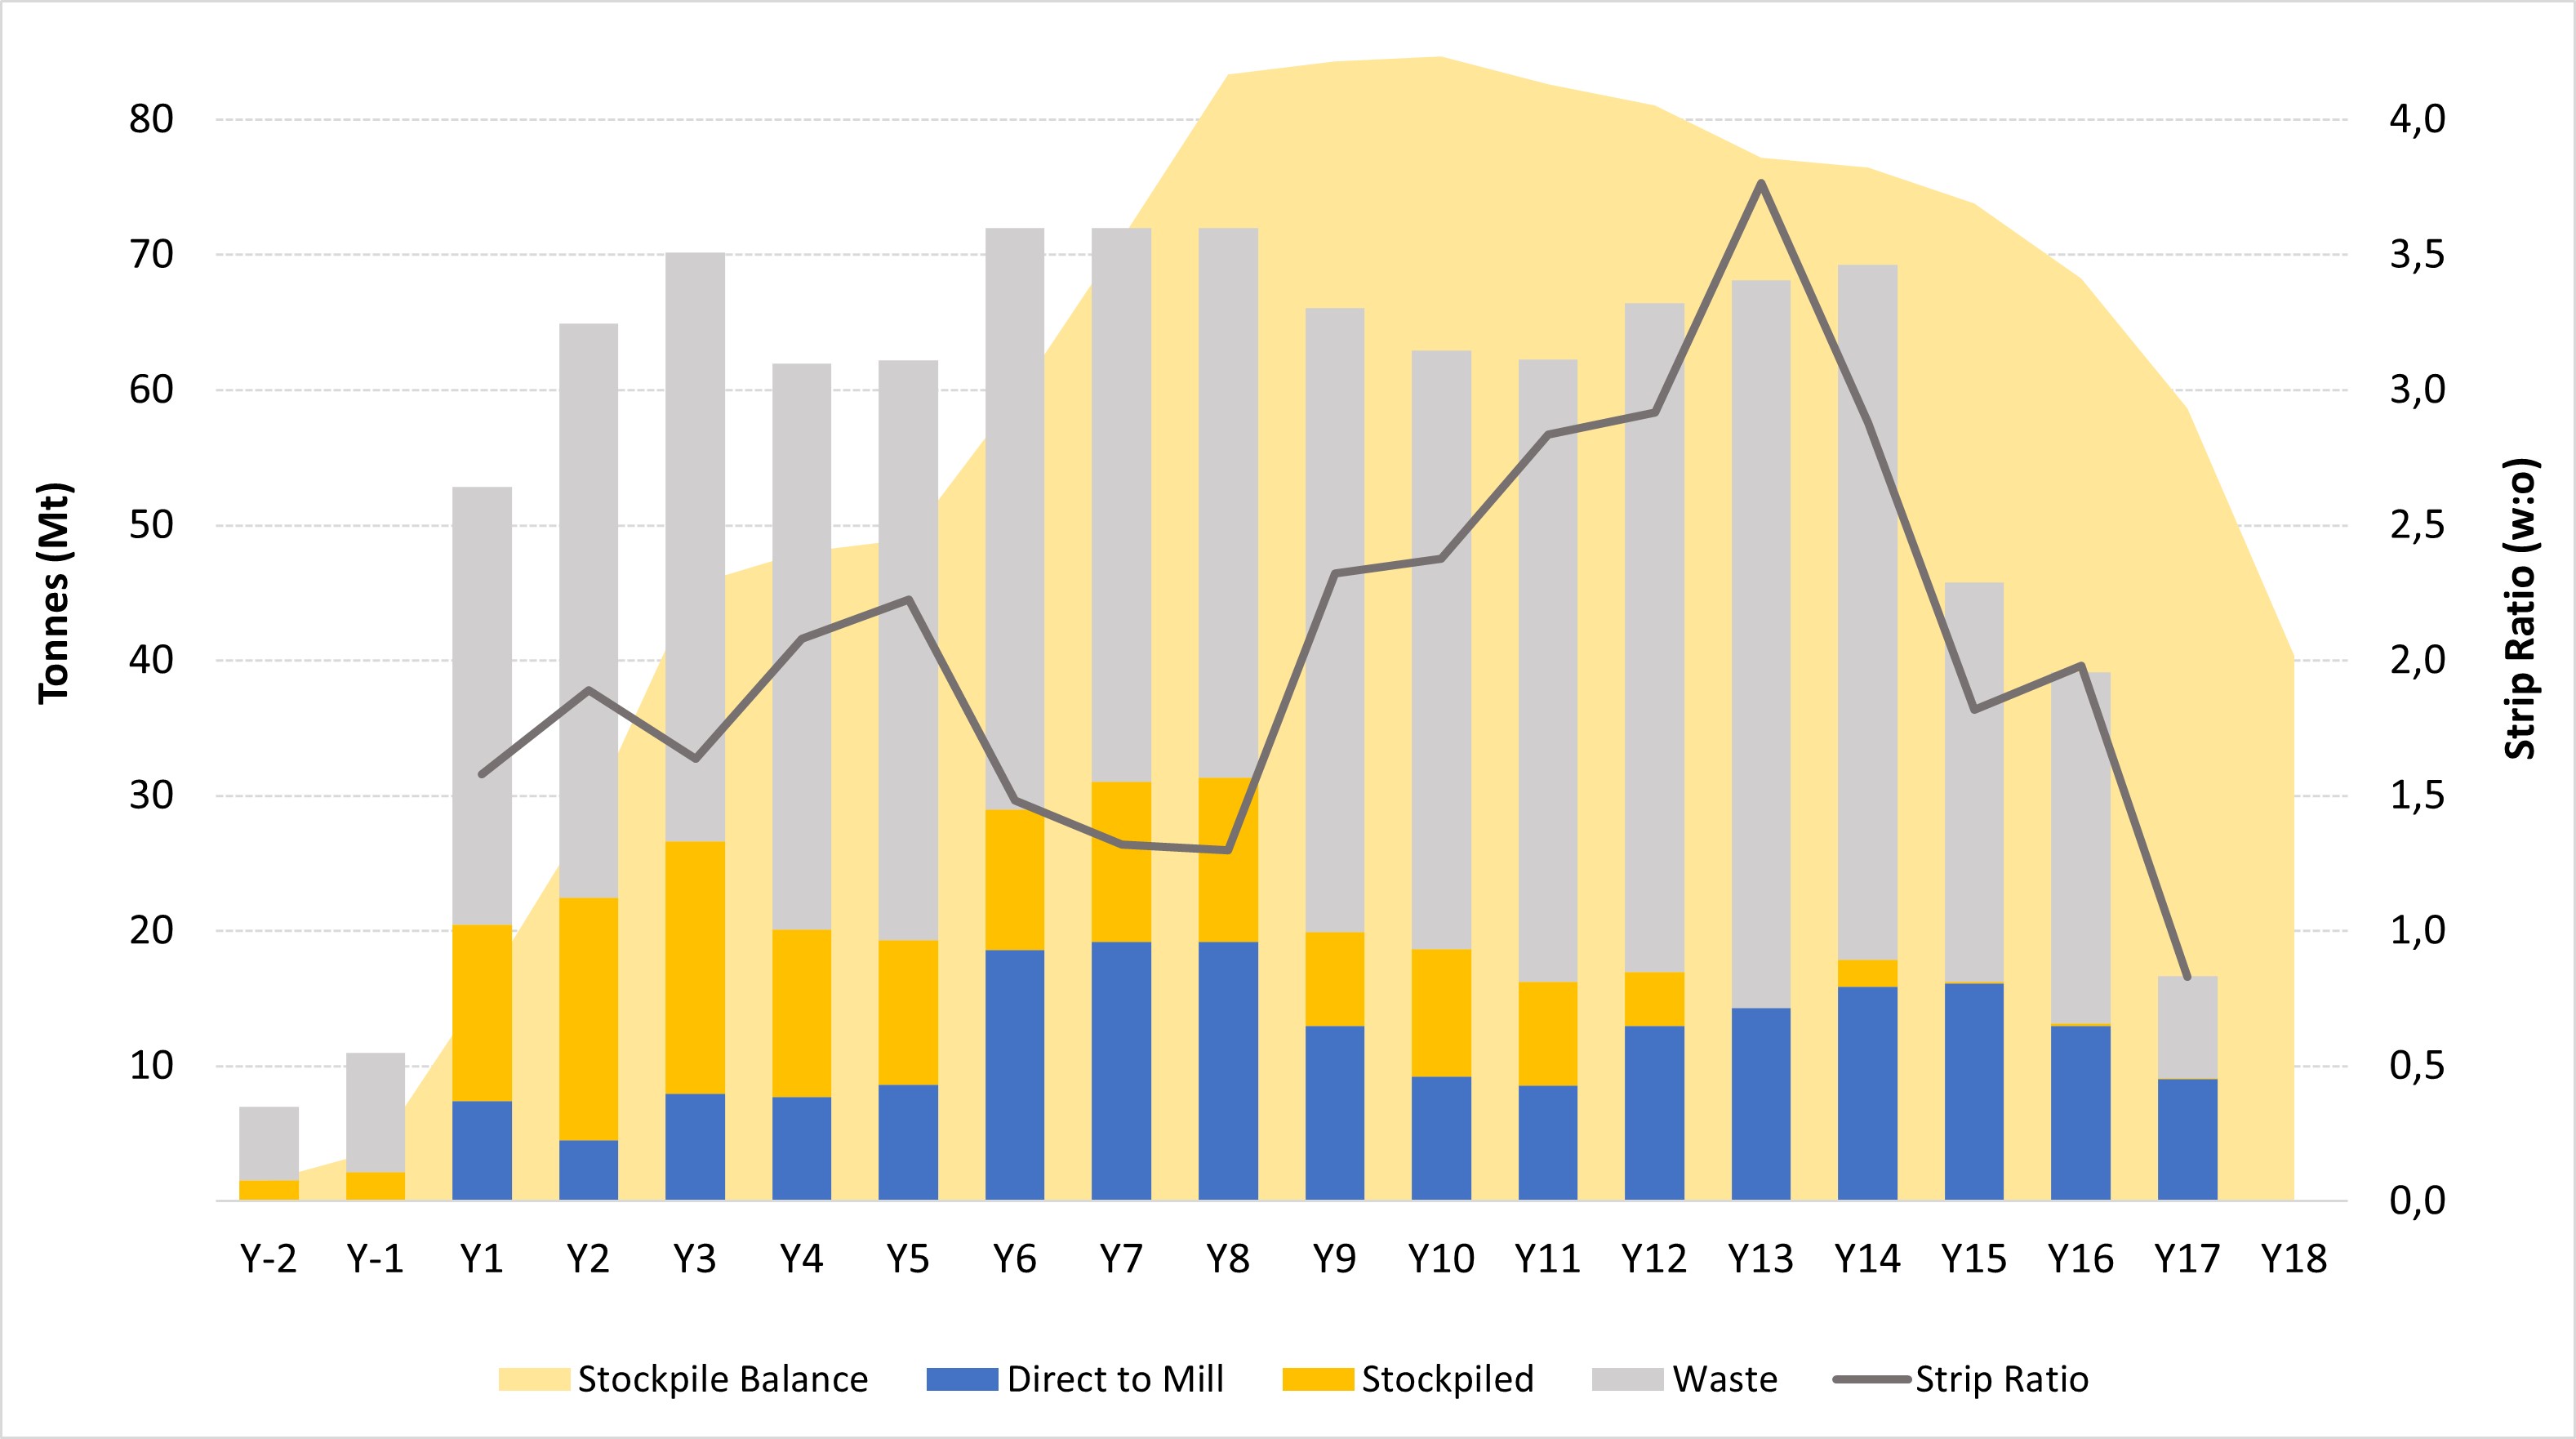
The mine plan incorporates accelerated stripping as well as stockpiling of low-grade material to optimize the grade profile over the LOM.
- The mine plan is based on a detailed mine design that incorporates mining dilution, ore loss, safety berms and haul roads.
- Following a steady ramp up period, the mining rates over the life of the mine are relatively consistent at approximately 70 Mt/a.
- The ultimate pit contains 1,042 Mt in total consisting of 327 Mt of ore, 696 Mt of waste and 19 Mt of stockpiled oxide material above cut-off. The average strip ratio is 2.0:1 and is even over the LOM.
- Pit slope designs were based on eight geotechnical core holes and logging of core from exploration core holes.
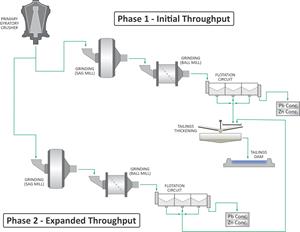
Processing
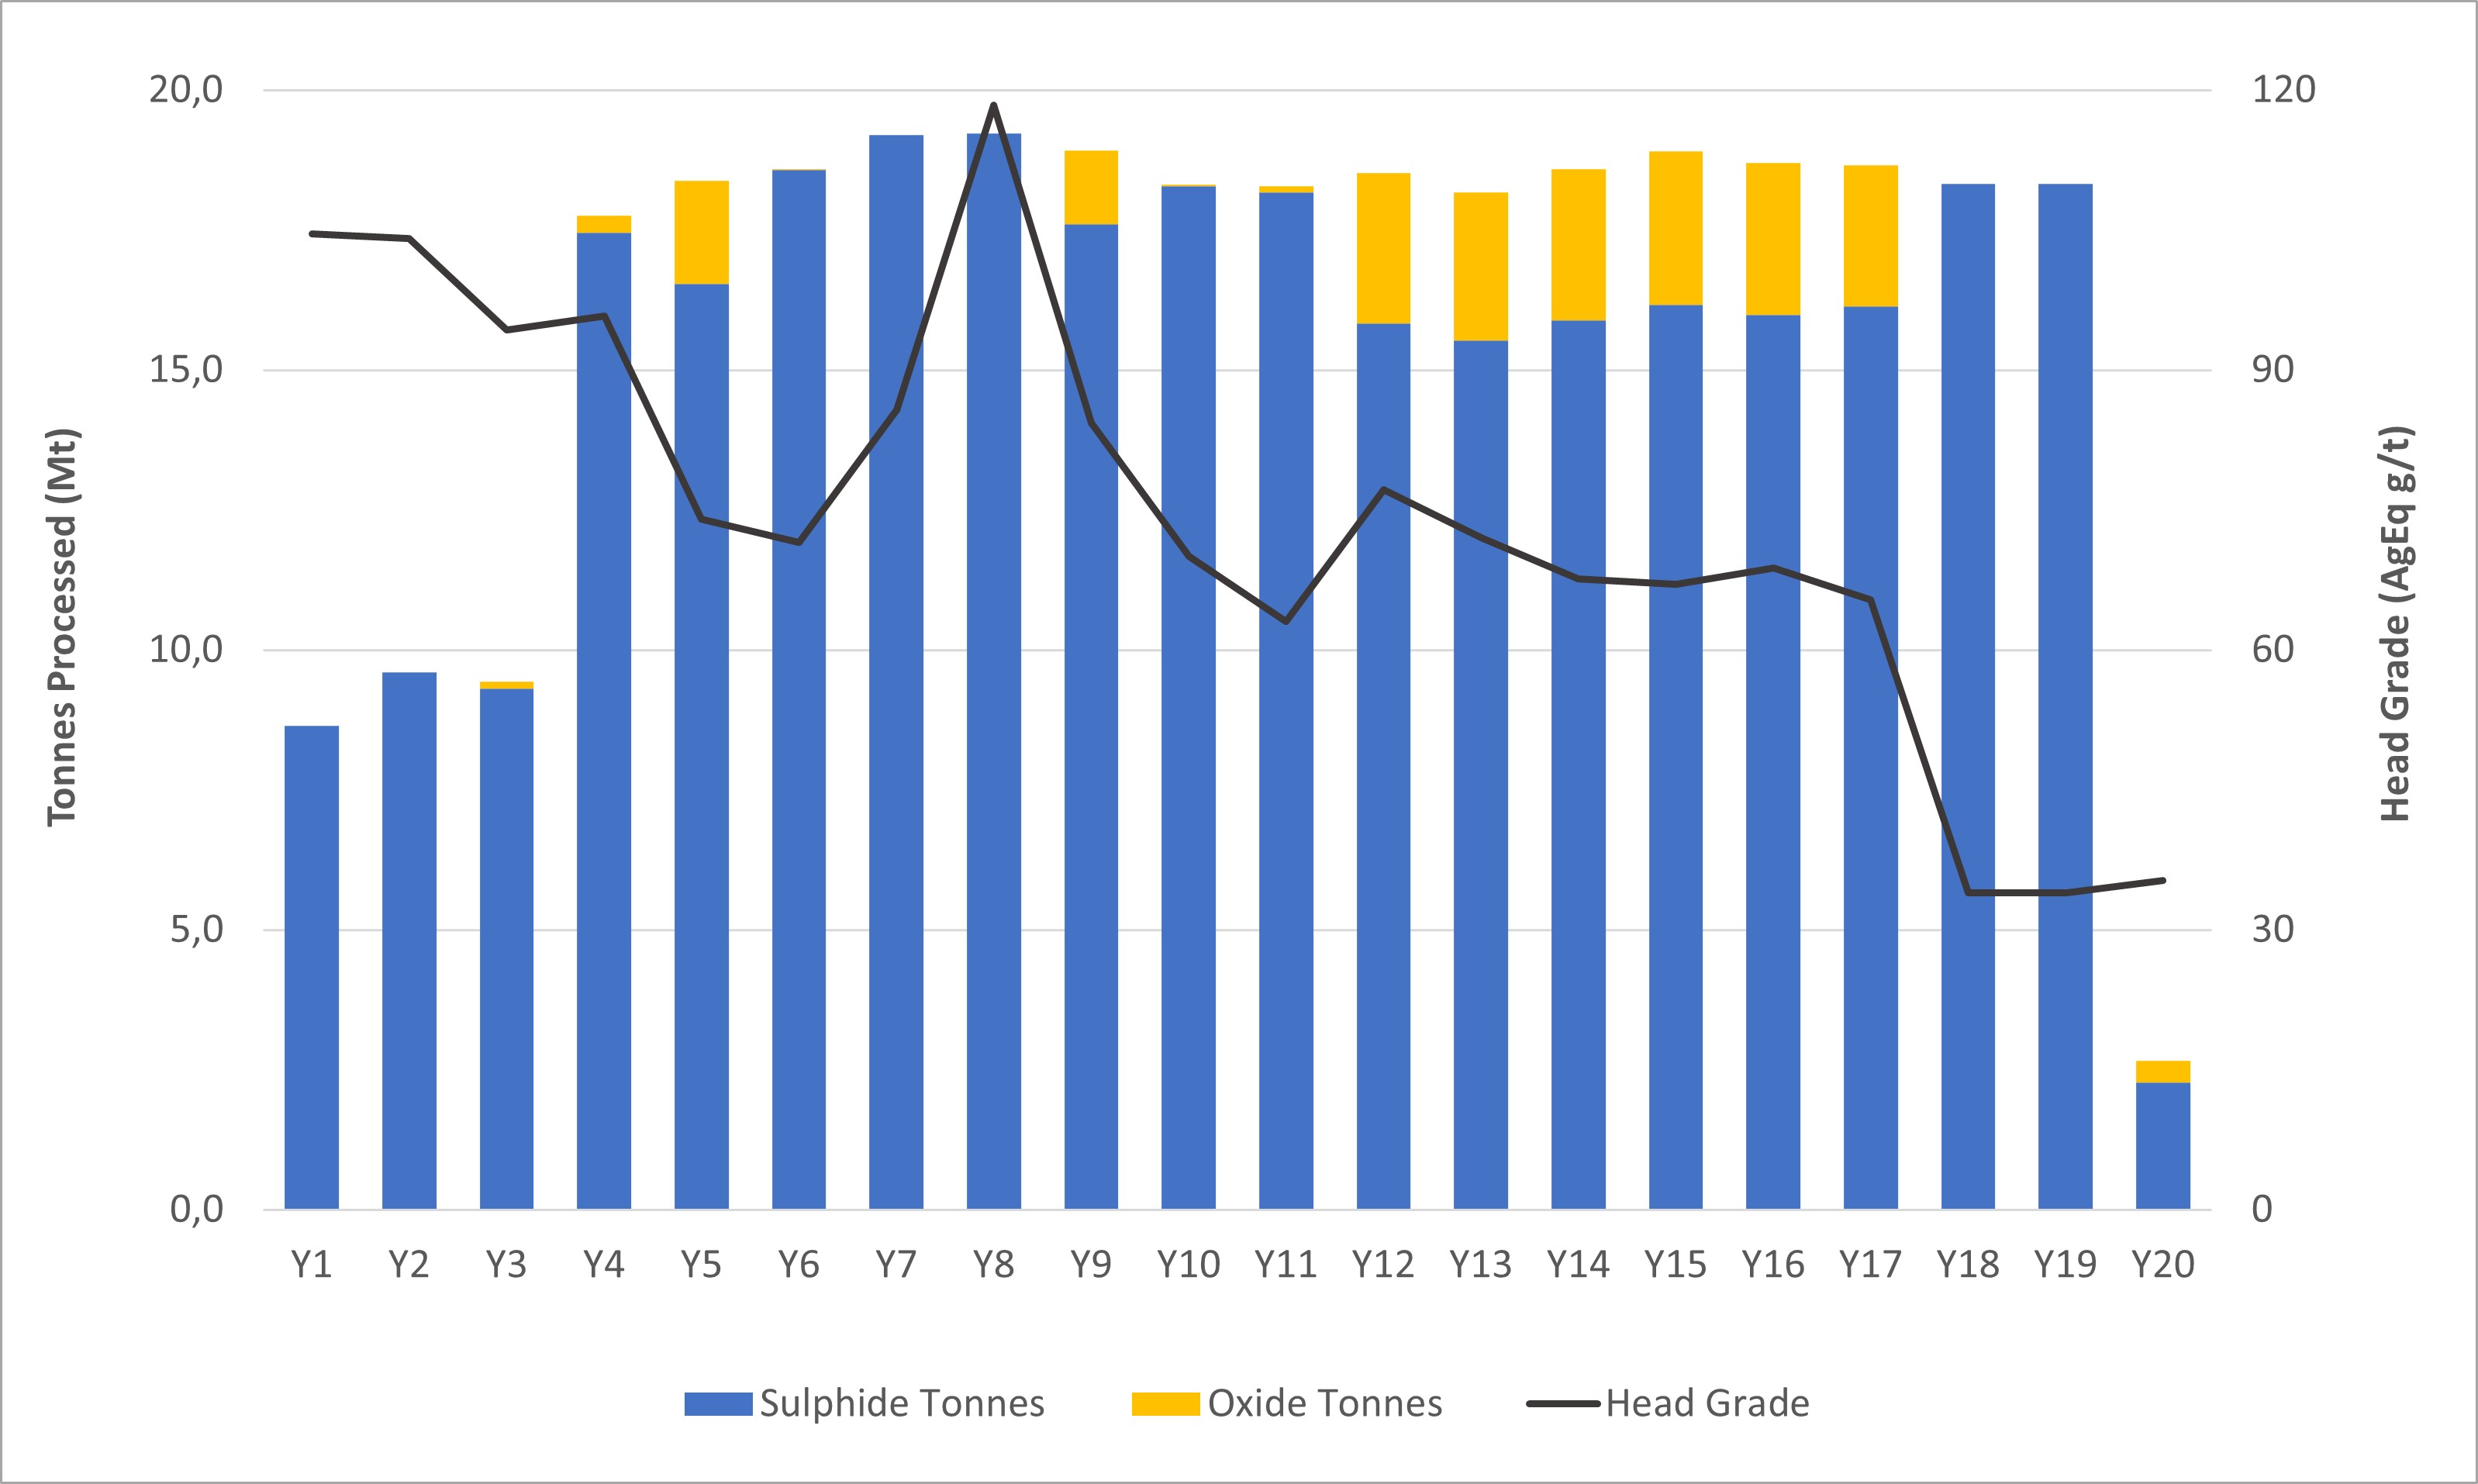
Processing was broken into two main phases to optimize the capital efficiency of the project. Oxides and sulphides are co-processed up to a maximum oxide tonnage proportion of 15% of total mill feed.
- Phase 1 throughput (Year 1 to Year 4): Year 1 is a ramp up year with throughput at 80% of nameplate capacity of 9.6 Mt/a (~26,000 tpd). Year 4 is a transition year to Phase 2 throughput levels. Oxides represent 1% of mill feed during Phase 1.
- Phase 2 throughput (Year 5+): Nameplate capacity of 19.2 Mt/a (51,000 tpd)
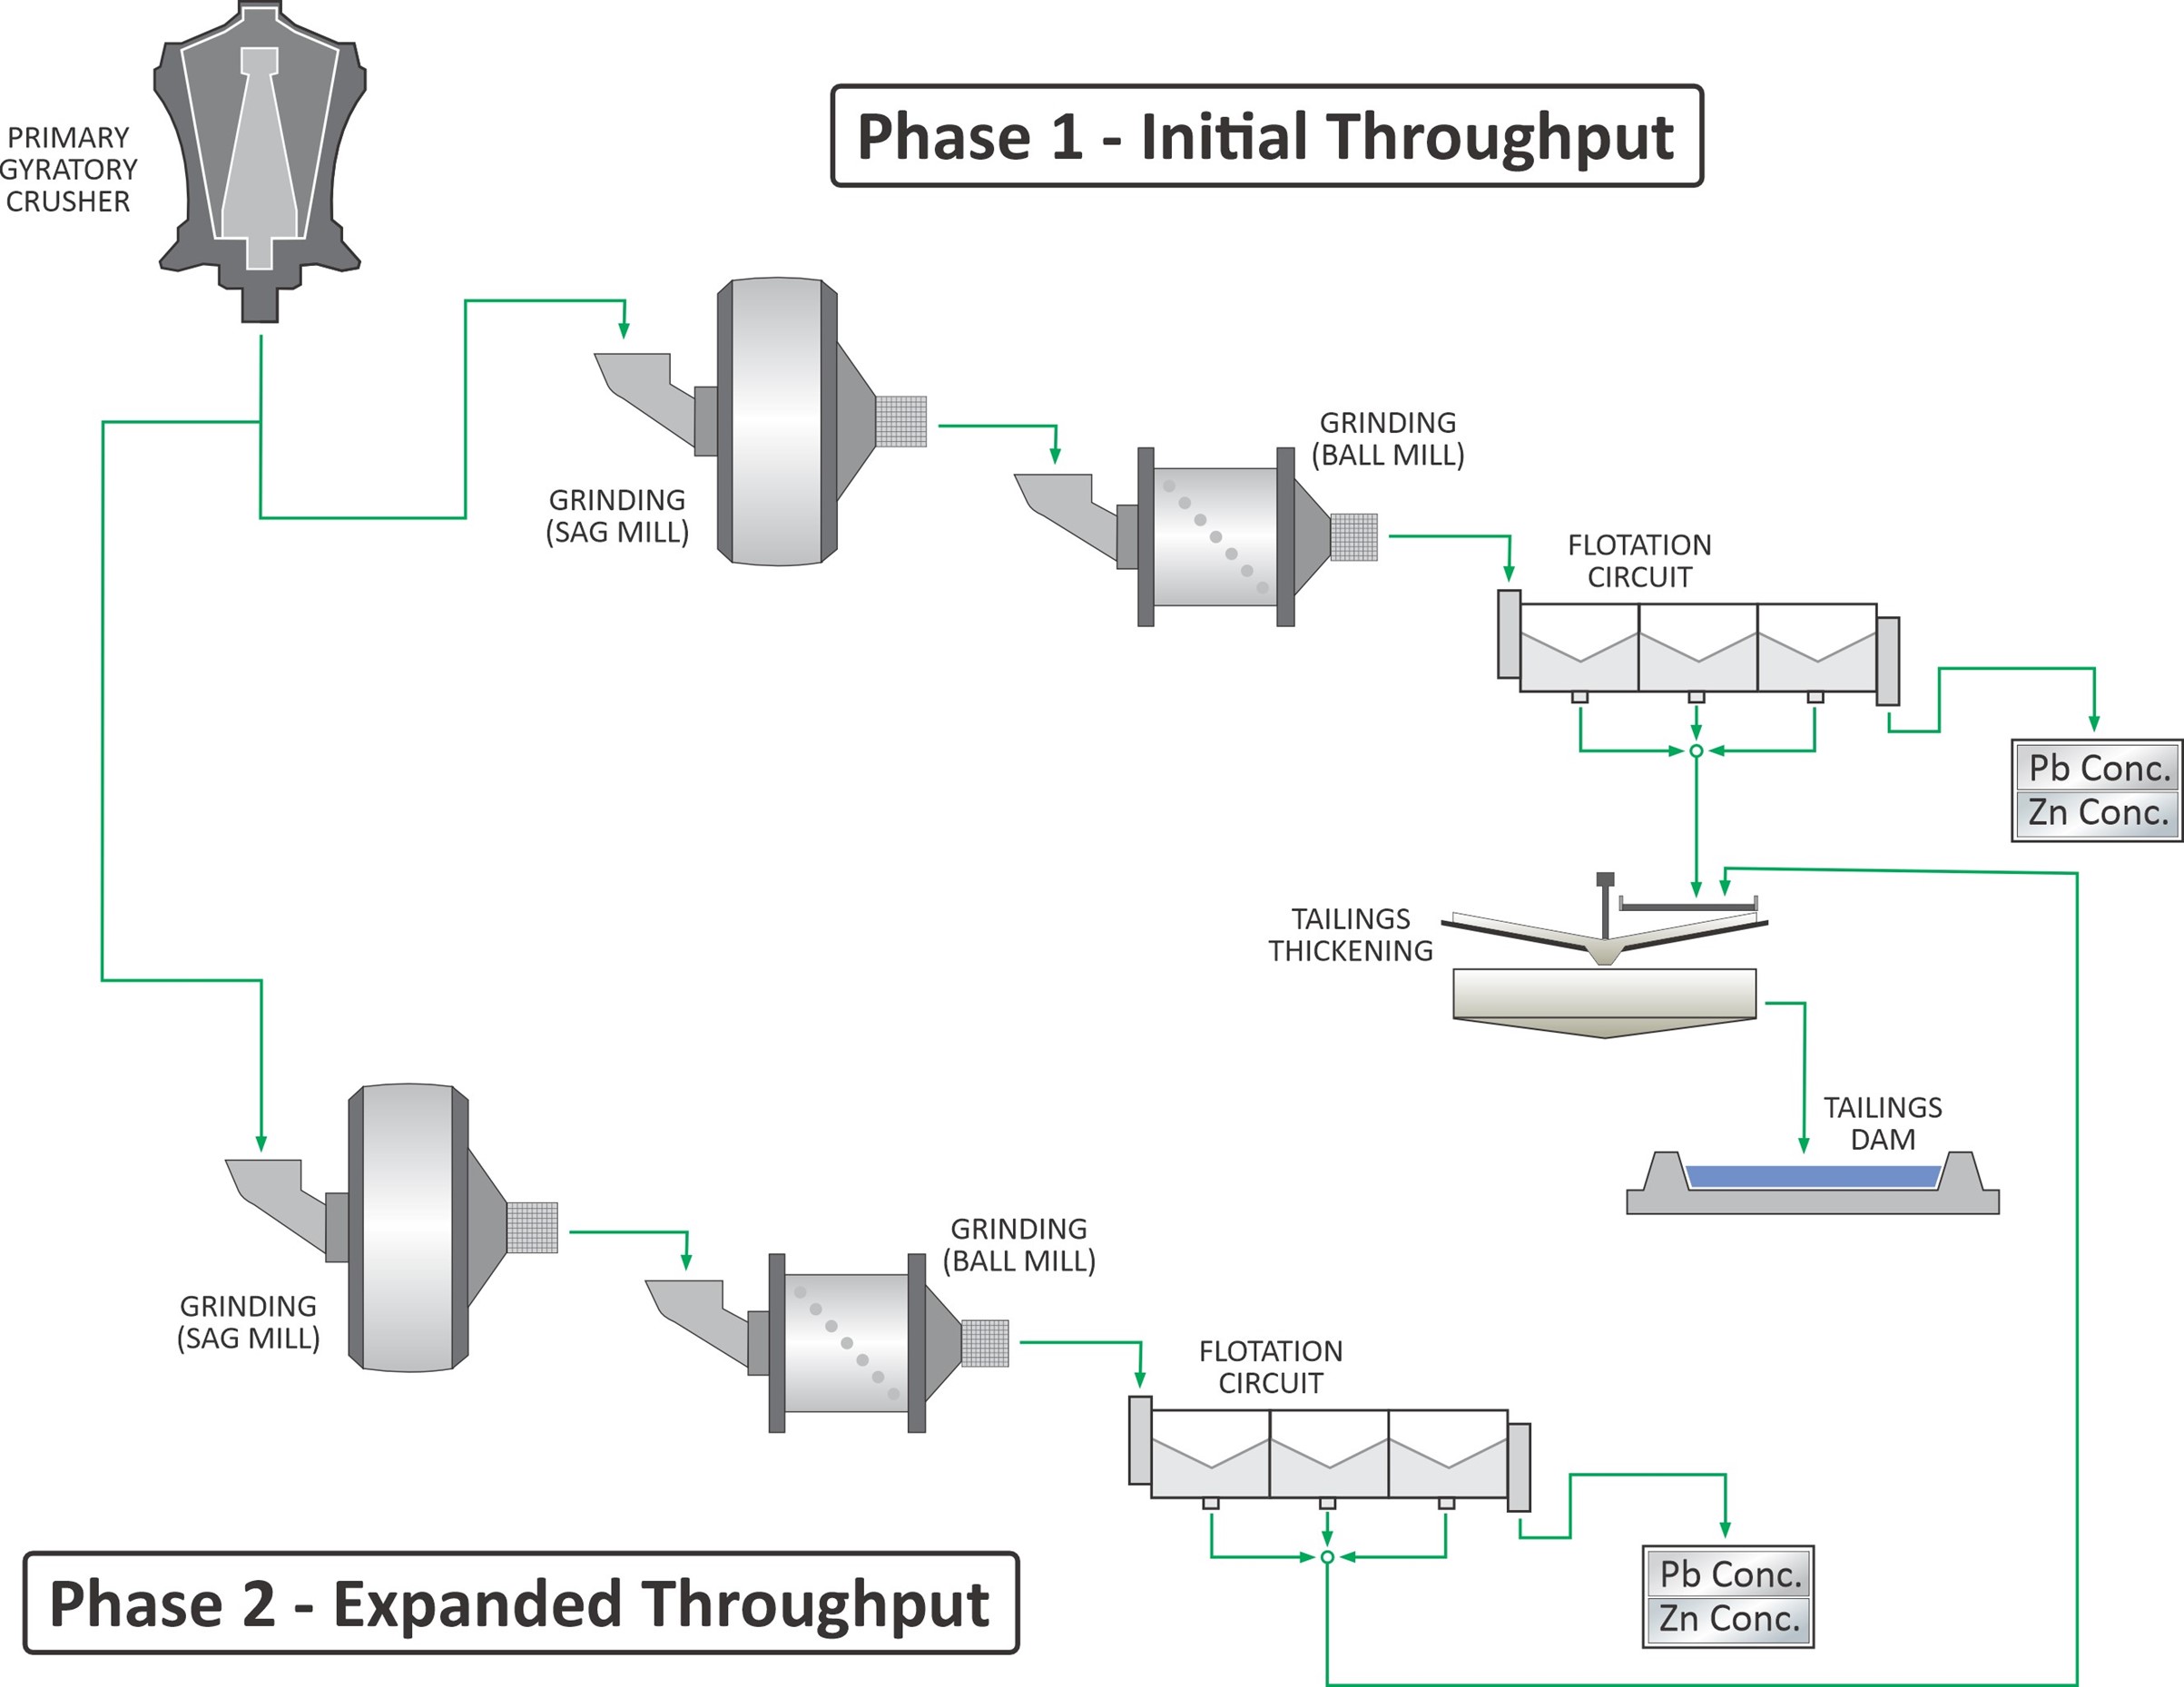
- Process design
- Phase 1: primary crushing, grinding (SAG and ball milling to a targeted grind size of 200 micron) and two-stage flotation to produce Precious Metals and Zn concentrates.
- Phase 2: addition of parallel grinding and flotation circuits.
Head grades
The mine plan focuses on feeding higher grades to the mill earlier in the mine life:
- Year 1 – 4: processing of higher-grade sulphide material predominantly from the Pozo de Plata zone
- Year 5 – 16: processing of higher-grade sulphides from the NE Extension and the South Corridor
- Year 17 – 19: processing of mostly lower-grade stockpiled material
| TONNES PROCESSED / HEAD GRADES | UNIT | PHASE 1 | PHASE 2 | LOM | |
| Year 1 – 4 | Year 5 – 12 | Year 13 – 19 | |||
| Oxide tonnes processed | (Mt) | 0 | 6 | 14 | 20 |
| Sulphide tonnes processed | (Mt) | 45 | 143 | 119 | 307 |
| Tonnes processed | (Mt) | 45 | 149 | 132 | 327 |
| Head Grades | |||||
| Ag | (g/t) | 42 | 30 | 23 | 29 |
| Au | (g/t) | 0.19 | 0.07 | 0.06 | 0.08 |
| Pb | (%) | 0.57 | 0.44 | 0.32 | 0.41 |
| Zn | (%) | 0.67 | 0.86 | 0.58 | 0.72 |
| AgEq | (g/t) | 99 | 81 | 58 | 74 |
Recoveries
Metal recoveries to the two concentrates are based on the three rounds of detailed metallurgical testwork completed by the Company and are summarized below:
| METALLURGICAL RECOVERIES (weighted average) | PHASE 1 | PHASE 2 | LOM | |
| Year 1 – 4 | Year 5 – 12 | Year 13 – 19 | ||
| Ag | 91% | 87% | 81% | 87% |
| Au | 28% | 28% | 28% | 28% |
| Pb | 91% | 88% | 81% | 86% |
| Zn | 84% | 86% | 84% | 85% |
Tailings Storage Facility (TSF)
- The TSF was designed adhering to design criteria to minimize risk for its lifecycle in accordance with the Global Industry Standard on Tailings Management (“GISTM”).
- The design is based on deposition of high-density thickened tailings into a tailings storage facility that utilizes the ‘downstream expansion’ embankment construction method.
- The TSF is located directly east of the open pit. The design incorporates a total of five dam stages over the LOM (starter dam and four downstream expansions).
- Total capacity of the TSF is greater than the estimated volume requirement of 327 Mt generated by the FS mine plan and additional downstream expansion can be incorporated to store additional tailings if required.
OPERATING COSTS
Operating costs are summarized in the table below.
| PARAMETER | UNITS | FS COST |
| OPERATING COSTS | ||
| Mining | $/t mined | 2.35 |
| Mining | $/t milled | 7.35 |
| Processing – Milling (Phase 1) | $/t milled | 6.56 |
| Processing – Milling (Phase 2) | $/t milled | 6.24 |
| Site G&A (Phase 1) | $/t milled | 0.97 |
| Site G&A (Phase 2) | $/t milled | 0.54 |
Mining
- Mining is assumed to be owner-operated with lease financing. Estimated mining costs were built from first principles. The cost of diesel was assumed to be $1.15/L compared to $1.10/L in the PFS.
- The lease financing structure assumes a 25% initial deposit, a term of five years and an annual lease financing cost of 10.2%.
Processing
- Processing costs for the crushing/milling/flotation/concentrate dewatering, and G&A costs were developed from first principles.
- Processing costs benefit from a conventional grinding and flotation concentrator process design, low power unit costs, a targeted coarse grind size of 200 micron, relatively low cost of labor, and economies of scale.
G&A
- G&A costs estimates are based on a small management camp and administration offices at site. The majority of the work force will be Mexican nationals commuting daily from the town of Parral. Parral is 34 km south of Cordero and has a population of approximately 120,000. It is the regional government centre in the southern part of Chihuahua State and has a well-established service industry that supports numerous local mining operations.
CONCENTRATE TERMS
Metal Payable
- Cordero is expected to produce clean, highly saleable concentrates with minimal penalty elements.
- Industry standard payables and deductions were applied to the Precious Metals (PM) and Zn concentrates as per the table below. A metallurgical balance summary is included in the Appendices.
- Approximately 89% of recovered silver reports to the PM concentrate where higher silver payabilities are received.
| Ag | Au | Pb | Zn | |
| Precious Metals Concentrate | ||||
| Average concentrate grade LOM | 3,062 | 2.05 | 50% | - |
| Payable metal | 95% | 95% | 95% | - |
| Minimum deduction | 50 g/t | 1 g/t | 3 units | - |
| Zn Concentrate | ||||
| Average concentrate grade LOM | 231 g/t | 0.62 g/t | - | 50% |
| Payable metal | 70% | 70% | - | 85% |
| Deduction | 93 g/t | 1 g/t | - | 8 units |
Treatment/Refining Charges
- Treatment and refining charges are based on a review of spot and recent benchmark pricing and are summarized as follows:
| PARAMETER | UNITS | FS COST | SPOT | 5-YEAR BENCHMARK AVERAGE | |
| TREATMENT/REFINING CHARGES | |||||
| Treatment charge – PM concentrate | $/dmt | $120 | ~$25 | ~$130 | |
| Treatment charge – Zn concentrate | $/dmt | $200 | ~$90 | ~$240 | |
| Ag refining charge – PM concentrate | $/oz | $1.00 | ~$1.00 | ~$1.10 | |
Concentrate Transportation
- Transportation costs assume trucking of the concentrate to the international ports at Guaymas and Manzanillo, and then shipping via ocean freight to Asia.
- Estimated transportation costs (trucking, port handling and ocean freight) are $176/wet metric tonne (“wmt”) for the PM concentrate and $135/wmt for Zn concentrate.
2024 FS vs 2023 PFS
Summary
The main changes in the FS in comparison to the PFS include:
- An additional 33,400 m of reserve definition and expansion drilling that extended the mine life to 19 years and increased the confidence level of declared reserves with 71% of silver reserves in the Proven category versus 58% in the PFS.
- Incorporating the positive results from the FS metallurgical testwork program that increased silver recoveries into the precious metals concentrate by 6% (where higher payabilities are received) whilst reducing reagent consumption.
- An additional 2,700 m of geotech drilling in 34 drill holes, 44 test pits and 24 seismic lines resulting in increased confidence of pit slope assumptions and earthworks programs.
- Increase in initial capital expenditures of $151 million to $606 million as summarized in further detail below.
- Modest deterioration in IRR and payback due to the higher initial capital expenditures.
| PARAMETER | UNITS | 2023 PFS | 2024 FS |
| SUMMARY | |||
| After-Tax NPV (5% discount rate) | (US$ M) | $1,153 | $1,177 |
| Internal Rate of Return | (%) | 28.0% | 22.0% |
| Mine Life | (yrs) | 18 | 19 |
| Initial Capital | (US$ M) | $455 | $606 |
| LOM Capital | (US$ M) | $1,003 | $1,377 |
| Payback | (yrs) | 4.2 | 5.2 |
| OPERATIONS | |||
| Tonnes Processed (LOM – Total) | (Mt) | 302 | 327 |
| Strip ratio (LOM) | (w:o) | 2.1 | 2.0 |
| PRODUCTION & COSTS | |||
| AgEq Produced (LOM – Annual Average) | (Moz) | 33 | 33 |
| AgEq Produced (LOM – Total) | (Moz) | 591 | 635 |
| All-In Sustaining Cost (Y1 – Y12) | (US$/AgEq oz) | $12.82 | $13.07 |
| All-In Sustaining Cost (LOM) | (US$/AgEq oz) | $13.62 | $13.47 |
Project Economics are based on Ag = $22.00/oz, Au = $1,600/oz, Pb = $1.00/lb, Zn = $1.20/lb. See Technical Disclosure section for AgEq and AISC calculation methodology.
Initial Capital Changes
Total initial capital expenditures increased by $151 million as summarized in the table below. The primary drivers behind this increase were:
- Mining – increase in pre-strip material and additional equipment and infrastructure
- Process plant – selection of preferred equipment vendors, additions to the process plant design to add redundancy for operations and cost inflation
- Offsite infrastructure – addition of the upgrade to the Camargo substation and addition of the water treatment plant upgrade plus water pipeline to site
| DESCRIPTION (all in US$ millions) | 2023 PFS | 2024 FS | Difference | |||||
| INITIAL CAPITAL EXPENDITURES | ||||||||
| Mining | $60 | $117 | $57 | |||||
| Onsite Infrastructure | $31 | $44 | $13 | |||||
| Processing Plant | $156 | $210 | $54 | |||||
| Tailings Facility (TSF) | $45 | $28 | ($17) | |||||
| Offsite Infrastructure | $20 | $57 | $37 | |||||
| Indirects | $61 | $73 | $12 | |||||
| Owners Costs | $13 | $11 | ($2) | |||||
| Contingency | $61 | $65 | $4 | |||||
| Total Initial Capital Expenditures | $455 | $606 | $151 | |||||
TECHNICAL DISCLOSURE:
- The FS project team was led by Ausenco Engineering Canada ULC (“Ausenco”), with support from AGP Mining Consultants Inc. (“AGP”), WSP USA Inc. (“WSP”) and RedDot3D Inc (“RedDot”).
- Mineral resources that are not mineral reserves do not have demonstrated economic viability.
- A full technical report will be prepared in accordance with NI 43-101 and will be filed on SEDAR within 45 days of this press release.
- AgEq produced and AgEq payable are calculated as Ag + (Au x 72.7) + (Pb x 45.5) + (Zn x 54.6); these factors are based on metal prices of Ag - $22/oz, Au - $1,600/oz, Pb - $1.00/lb and Zn - $1.20/lb.
- All-in Sustaining cost (AISC) is calculated as: [Operating costs (mining, processing and G&A) + Royalties + Concentrate Transportation + Treatment & Refining Charges + Concentrate Penalties + Sustaining Capital (excluding $37M of capex for the initial purchase of mining fleet in Year 1)] / Payable AgEq ounces
APPENDIX:
An appendix with the following supporting information can be found at the end of the release.
Appendix A - Mineral Resource Estimate
Appendix B – Mineral Reserve Estimate
Appendix C – After-Tax NPV/IRR/Payback Sensitivities
Appendix D - LOM Mine Plan Summary
Appendix E - LOM Process Throughput Summary
Appendix F – After-Tax Free Cash Flow
Appendix G - Simplified Process Flowsheets
Appendix H – Metallurgical Balance Summary
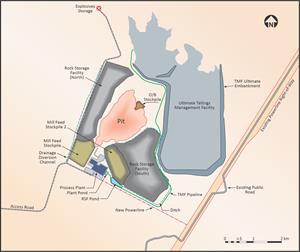
Appendix I - Site Layout
Appendix J - LOM Production & Cash Flow Schedule
About Discovery
Discovery’s flagship project is its 100%-owned Cordero silver project, one of the world’s largest silver deposits. The FS summarized in today’s release demonstrates that Cordero has the potential to be developed into a highly capital efficient mine that offers the rare combination of large-scale production, low costs and a long mine life. Cordero is located close to infrastructure in a prolific mining belt in Chihuahua State, Mexico.
On Behalf of the Board of Directors,
Tony Makuch, P.Eng
President & CEO
For further information contact:
Forbes Gemmell, CFA
VP Corporate Development
Phone: 416-613-9410
Email: forbes.gemmell@discoverysilver.com
Website: www.discoverysilver.com
Qualified Person
The FS for the Company’s Cordero Silver project as summarized in this release was completed by Ausenco with support from AGP and WSP. The Mineral Reserve estimate as outlined, as further set out in Appendix B, in this press release was completed under the supervision of Willie Hamilton, P.Eng. of AGP, who is an independent “Qualified Person” as defined under NI 43-101 and who has reviewed and approved the mineral reserve estimate disclosure in this press release. The Mineral Resource estimate, as further set out in Appendix A, as outlined in this press release was completed under the supervision of R. Mohan Srivastava, P.Geo., who is an independent “Qualified Person” as defined under NI 43-101 and who has reviewed and approved the mineral resource estimate disclosure in this press release. A full technical report supporting the FS will be prepared in accordance with NI 43-101 and will be filed on SEDAR within 45 days of this press release. The remaining scientific and technical content of this press release was reviewed and approved by Gernot Wober, P.Geo, VP Exploration of the Company and a “Qualified Person” as such term is defined in NI 43-101 and Pierre Rocque, P.Eng., an Independent Consultant to the Company, and an independent “Qualified Person” as such term is defined by 43-101.
NON-GAAP MEASURES:
The Company has included certain non-GAAP performance measures as detailed below. In the mining industry, these are common performance measures but may not be comparable to similar measures presented by other issuers and the non-GAAP measures do not have any standardized meaning. Accordingly, it is intended to provide additional information and should not be considered in isolation or as a substitute for measures of performance prepared in accordance with IFRS.
CASH COSTS PER OUNCE
The Company calculated total cash costs per ounce by dividing the sum of operating costs, royalty costs, production taxes, refining and shipping costs, by payable silver-equivalent ounces. While there is no standardized meaning of the measure across the industry, the Company believes that this measure is useful to external users in assessing operating performance.
ALL-IN SUSTAINING COSTS ("AISC")
The Company has provided an AISC performance measure that reflects all the expenditures that are required to produce an ounce of payable metal. While there is no standardized meaning of the measure across the industry, the Company’s definition conforms to the all-in sustaining cost definition as set out by the World Gold Council in its guidance dated June 27, 2013. Subsequent amendments to the guidance have not materially affected the figures presented.
FREE CASH FLOW
Free Cash Flow is a non-GAAP performance measure that is calculated as cash flows from operations net of cash flows invested in mineral property, plant and equipment and exploration and evaluation assets. The Company believes that this measure is useful to the external users in assessing the Company’s ability to generate cash flows from its mineral projects.
FORWARD-LOOKING STATEMENTS:
Neither TSX Exchange nor its Regulation Services Provider (as that term is defined in policies of the TSX Exchange) accepts responsibility for the adequacy or accuracy of this release.
This news release is not for distribution to United States newswire services or for dissemination in the United States.
This news release does not constitute an offer to sell or a solicitation of an offer to buy nor shall there be any sale of any of the securities in any jurisdiction in which such offer, solicitation or sale would be unlawful, including any of the securities in the United States of America. The securities have not been and will not be registered under the United States Securities Act of 1933, as amended (the “1933 Act”) or any state securities laws and may not be offered or sold within the United States or to, or for account or benefit of, U.S. Persons (as defined in Regulation S under the 1933 Act) unless registered under the 1933 Act and applicable state securities laws, or an exemption from such registration requirements is available.
Cautionary Note Regarding Forward-Looking Statements
This news release may include forward-looking statements that are subject to inherent risks and uncertainties. All statements within this news release, other than statements of historical fact, are to be considered forward looking. Although Discovery believes the expectations expressed in such forward-looking statements are based on reasonable assumptions, such statements are not guarantees of future performance and actual results or developments may differ materially from those described in forward-looking statements. Statements include but are not limited to the feasibility of the Project and its attractive economics and significant exploration upside; construction decision and development of the Project, timing and results of the feasibility study and the anticipated capital and operating costs, sustaining costs, net present value, internal rate of return, the method of mining the Project, payback period, process capacity, average annual metal production, average process recoveries, concession renewal, permitting of the Project, anticipated mining and processing methods, feasibility study production schedule and metal production profile, anticipated construction period, anticipated mine life, expected recoveries and grades, anticipated production rates, infrastructure, social and environmental impact studies, the completion of key de-risking items, including the timing of receipt permits, availability of water and power, availability of labour, job creation and other local economic benefits, tax rates and commodity prices that would support development of the Project, and other statements that express management's expectations or estimates of future performance, operational, geological or financial results Information concerning mineral resource/reserve estimates and the economic analysis thereof contained in the results of the feasibility study are also forward-looking statements in that they reflect a prediction of the mineralization that would be encountered, and the results of mining, if a mineral deposit were developed and mined. Forward-looking statements are statements that are not historical facts which address events, results, outcomes or developments that the Company expects to occur. Forward-looking statements are based on the beliefs, estimates and opinions of the Company’s management on the date the statements are made and they involve a number of risks and uncertainties.
Factors that could cause actual results to differ materially from those described in forward-looking statements include fluctuations in market prices, including metal prices, continued availability of capital and financing, and general economic, market or business conditions, the actual results of current and future exploration activities; changes to current estimates of mineral reserves and mineral resources; conclusions of economic and geological evaluations; changes in project parameters as plans continue to be refined; the speculative nature of mineral exploration and development; risks in obtaining and maintaining necessary licenses, permits and authorizations for the Company’s development stage and operating assets; operations may be exposed to new diseases, epidemics and pandemics, including any ongoing or future effects of COVID-19 (and any related ongoing or future regulatory or government responses) and its impact on the broader market and the trading price of the Company’s shares; provincial and federal orders or mandates (including with respect to mining operations generally or auxiliary businesses or services required for operations) in Mexico, all of which may affect many aspects of the Company's operations including the ability to transport personnel to and from site, contractor and supply availability and the ability to sell or deliver mined silver; changes in national and local government legislation, controls or regulations; failure to comply with environmental and health and safety laws and regulations; labour and contractor availability (and being able to secure the same on favourable terms); disruptions in the maintenance or provision of required infrastructure and information technology systems; fluctuations in the price of gold or certain other commodities such as, diesel fuel, natural gas, and electricity; operating or technical difficulties in connection with mining or development activities, including geotechnical challenges and changes to production estimates (which assume accuracy of projected ore grade, mining rates, recovery timing and recovery rate estimates and may be impacted by unscheduled maintenance); changes in foreign exchange rates (particularly the Canadian dollar, U.S. dollar and Mexican peso); the impact of inflation; geopolitical conflicts; employee and community relations; the impact of litigation and administrative proceedings (including but not limited to mining reform laws in Mexico) and any interim or final court, arbitral and/or administrative decisions; disruptions affecting operations; availability of and increased costs associated with mining inputs and labour; delays in construction decisions and any development of the Project; changes with respect to the intended method of mining and processing ore from the Project; inherent risks and hazards associated with mining and mineral processing including environmental hazards, industrial accidents, unusual or unexpected formations, pressures and cave-ins; the risk that the Company’s mines may not perform as planned; uncertainty with the Company's ability to secure additional capital to execute its business plans; contests over title to properties; expropriation or nationalization of property; political or economic developments in Canada and Mexico and other jurisdictions in which the Company may carry on business in the future; increased costs and risks related to the potential impact of climate change; the costs and timing of exploration, construction and development of new deposits; risk of loss due to sabotage, protests and other civil disturbances; the impact of global liquidity and credit availability and the values of assets and liabilities based on projected future cash flows; risks arising from holding derivative instruments; and business opportunities that may be pursued by the Company.There can be no assurances that such statements will prove accurate and, therefore, readers are advised to rely on their own evaluation of such uncertainties. Discovery does not assume any obligation to update any forward-looking statements except as required under applicable laws. The risks and uncertainties that may affect forward-looking statements, or the material factors or assumptions used to develop such forward-looking information, are described under the heading "Risks Factors" in the Company’s Annual Information Form dated March 30, 2023, which is available under the Company’s issuer profile on SEDAR+ at www.sedarplus.ca.
APPENDIX A – MINERAL RESOURCE ESTIMATE
| Material | Class | Tonnes | Grade | Contained Metal | ||||||||
| Ag | Au | Pb | Zn | AgEq | Ag | Au | Pb | Zn | AgEq | |||
| (Mt) | (g/t) | (g/t) | (%) | (%) | (g/t) | (Moz) | (koz) | (Mlb) | (Mlb) | (Moz) | ||
| Oxide | Measured | 29 | 29 | 0.07 | 0.23 | 0.27 | 49 | 27 | 67 | 148 | 171 | 45 |
| Indicated | 37 | 24 | 0.06 | 0.25 | 0.29 | 44 | 28 | 74 | 207 | 241 | 53 | |
| M&I | 66 | 26 | 0.07 | 0.24 | 0.28 | 46 | 55 | 142 | 355 | 412 | 99 | |
| Inferred | 32 | 19 | 0.03 | 0.26 | 0.33 | 42 | 20 | 35 | 188 | 234 | 43 | |
| Sulphide | Measured | 324 | 24 | 0.07 | 0.34 | 0.63 | 57 | 247 | 745 | 2,413 | 4,473 | 598 |
| Indicated | 329 | 18 | 0.04 | 0.28 | 0.58 | 48 | 190 | 416 | 2,045 | 4,215 | 506 | |
| M&I | 653 | 21 | 0.06 | 0.31 | 0.60 | 53 | 437 | 1,161 | 4,458 | 8,687 | 1,104 | |
| Inferred | 116 | 12 | 0.02 | 0.16 | 0.35 | 30 | 45 | 86 | 418 | 906 | 111 | |
| TOTAL | Measured | 353 | 24 | 0.07 | 0.33 | 0.60 | 57 | 274 | 812 | 2,561 | 4,644 | 643 |
| Indicated | 366 | 19 | 0.04 | 0.28 | 0.55 | 47 | 218 | 490 | 2,252 | 4,456 | 559 | |
| M&I | 719 | 21 | 0.06 | 0.30 | 0.57 | 52 | 493 | 1,303 | 4,813 | 9,099 | 1,202 | |
| Inferred | 149 | 14 | 0.03 | 0.18 | 0.35 | 32 | 65 | 121 | 606 | 1,140 | 155 | |
Supporting Technical Disclosure for Resource
- Mineral Resource Estimates are inclusive of Mineral Reserves.
- The previous Cordero mineral resource estimate (MRE) was completed in January 2023 for Cordero by RedDot. The current mineral resource estimate was calculated for Discovery Silver by RedDot, who is acting as this report’s QP for mineral resources.
- Mineral resources that are not mineral reserves do not have demonstrated economic viability.
- The Resource is an in-pit resource containing a total of 868 Mt of Mineral Resource and 1,639 Mt of waste (below NSR$7.25 cut off) for total tonnes of 2,507,Mt). The pit is constrained by a pit optimisation based on the following parameters:
- Commodity prices: Ag - $24.00/oz, Au - $1,800/oz, Pb - $1.10/lb, Zn - $1.20/lb.
- Metallurgical recoveries: Ag – 87%, Au – 18%, Pb – 89% and Zn – 88%. AgEq for sulphide mineralization and Ag – 59%, Au – 18%, Pb - 37% and Zn - 85% for oxide mineralization.
- Operating costs:
- Base mining costs of $1.59/t for ore and $1.59/t for waste were developed by AGP Mining Consultants Inc.
- Processing costs of $5.22/t for mill/flotation and G&A costs of $0.86/t were developed by Ausenco Engineering Canada ULC.
- Average pit slope assumption of 450
- Sulphide and Oxide mineral resources are reported at a $7.25/t NSR cut-off based on the approximate estimated processing and G&A cost for mineralization. NSR is defined as the net revenue from metal sales (taking into account metallurgical recoveries and payabilities) less treatment costs and refining charges.
- Individual metals are reported at 100% of in-situ grade.
- AgEq for sulphide mineral resources is calculated as Ag + (Au x 15.52) + (Pb x 32.15) + (Zn x 34.68); these factors are based on commodity prices of Ag - $24.00/oz, Au - $1,800/oz, Pb - $1.10/lb, Zn - $1.20/lb and assumed recoveries of Ag – 87%, Au – 18%, Pb – 89% and Zn – 88%. AgEq for oxide mineral resources is calculated as Ag + (Au x 22.88) + (Pb x 19.71) + (Zn x 49.39); these factors are based on commodity prices of Ag - $24.00/oz, Au - $1,800/oz, Pb - $1.10/lb and Zn - $1.20/lb and assumed recoveries of Ag – 59%, Au – 18%, Pb - 37% and Zn - 85%.
- There are no known factors or issues that materially affect the mineral resource and mineral reserve estimates other than normal risks faced by mining projects in Mexico in terms of legal, environmental, permitting, taxation, socio-economic, and political factors. Additional risk factors are listed in the "Cautionary Note Regarding Forward-Looking Statements" section in this news release
- The effective date of the Resource is August 31, 2023, and is based on drilling through end of March 2023. A full technical report will be prepared in accordance with NI 43-101 and will be filed on SEDAR within 45 days of this press release.
APPENDIX B – MINERAL RESERVE ESTIMATE
| Material | Class | Tonnes | Grade | Contained Metal | ||||||
| Ag | Au | Pb | Zn | Ag | Au | Pb | Zn | |||
| (Mt) | (g/t) | (g/t) | (%) | (%) | (Moz) | (Moz) | (Blb) | (Blb) | ||
| Oxide | Proven | 10 | 46 | 0.08 | 0.35 | 0.38 | 15 | 0.03 | 0.08 | 0.09 |
| Probable | 10 | 40 | 0.09 | 0.40 | 0.42 | 13 | 0.03 | 0.09 | 0.09 | |
| Total P&P | 20 | 43 | 0.08 | 0.37 | 0.40 | 28 | 0.05 | 0.17 | 0.18 | |
| Sulphide | Proven | 212 | 29 | 0.09 | 0.42 | 0.74 | 199 | 0.61 | 1.96 | 3.48 |
| Probable | 95 | 24 | 0.06 | 0.40 | 0.73 | 74 | 0.18 | 0.83 | 1.53 | |
| Total P&P | 307 | 28 | 0.08 | 0.41 | 0.74 | 274 | 0.78 | 2.79 | 5.00 | |
| TOTAL | Proven | 223 | 30 | 0.09 | 0.42 | 0.73 | 214 | 0.64 | 2.04 | 3.57 |
| Probable | 104 | 26 | 0.06 | 0.40 | 0.70 | 87 | 0.20 | 0.91 | 1.62 | |
| Total P&P | 327 | 29 | 0.08 | 0.41 | 0.72 | 302 | 0.84 | 2.96 | 5.18 | |
Supporting Technical Disclosure for Reserves
- This mineral reserve estimate has an effective date of February 16, 2024, and is based on the mineral resource estimate, for Discovery Silver by RedDot that has an effective date of August 31, 2023.
- The Mineral Reserve estimate was completed under the supervision of Willie Hamilton, P.Eng. of AGP, who is a Qualified Person as defined under NI 43-101.
- Mineral Reserves are stated within the final pit designs based on a US$20.00/oz silver price, US$1,600/oz gold price, US$0.95/lb lead price and US$1.20/lb zinc price.
- An NSR cut-off of US$10.00/t was used to estimate reserves. The life-of-mine mining cost averaged US$2.35/t mined. Processing, G&A and closure costs were US$7.28/t ore. The metallurgical recoveries were varied according to head grade and concentrate grades. Lead concentrate recoveries for sulphide material were approximately 87.5%, 73.9% and 12.6% for lead, silver and gold respectively. Zinc concentrate recoveries for sulphide material were approximately 95.0%, 14.3% and 9.5% for zinc, silver and gold respectively. Oxide recoveries to zinc concentrates were 85%, 9% and 8% for zinc, silver, and gold respectively. Oxide recoveries to lead concentrates were 37%, 50% and 10% for lead, silver, and gold respectively.
APPENDIX C: AFTER-TAX NPV / IRR / PAYBACK SENSITIVITIES
Sensitivity of the Project’s NPV, IRR and payback at different Ag and Zn price assumptions is outlined in the table below. For these sensitivities the Au and Pb prices have been fixed at $1,600/oz and $1.00/lb respectively. The Base Case scenario for the FS is highlighted in grey below and assumes Ag - $22.00/oz, Au - $1,600/oz, Pb - $1.00/lb and Zn - $1.20/lb.
| Ag ($/oz) | |||||||||||||||||
| $18.00 | $20.00 | $22.00 | $25.00 | $30.00 | |||||||||||||
| NPV (5%) | IRR | Payback | NPV (5%) | IRR | Payback | NPV (5%) | IRR | Payback | NPV (5%) | IRR | Payback | NPV (5%) | IRR | Payback | |||
| (US$M) | (%) | (yrs) | (US$M) | (%) | (yrs) | (US$M) | (%) | (yrs) | (US$M) | (%) | (yrs) | (US$M) | (%) | (yrs) | |||
| Zn ($/lb) | $1.05 | 602 | 14.7 | 6.9 | 784 | 17.2 | 6.3 | 965 | 19.7 | 5.8 | 1,237 | 23.1 | 4.8 | 1,690 | 28.5 | 4.1 | |
| $1.10 | 673 | 15.6 | 6.7 | 854 | 18.1 | 6.2 | 1,036 | 20.4 | 5.6 | 1,308 | 23.8 | 4.8 | 1,761 | 29.2 | 4.0 | ||
| $1.20 | 814 | 17.4 | 6.4 | 996 | 19.7 | 5.9 | 1,177 | 22.0 | 5.2 | 1,449 | 25.2 | 4.6 | 1,902 | 30.5 | 3.9 | ||
| $1.30 | 955 | 18.9 | 6.1 | 1,137 | 21.2 | 5.5 | 1,318 | 23.4 | 4.9 | 1,590 | 26.6 | 4.4 | 2,043 | 31.7 | 3.8 | ||
| $1.45 | 1,167 | 21.2 | 5.7 | 1,348 | 23.4 | 5.1 | 1,530 | 25.5 | 4.7 | 1,802 | 28.6 | 4.2 | 2,254 | 33.5 | 3.7 | ||
APPENDIX D - LOM MINE PLAN SUMMARY
APPENDIX E - LOM PROCESS THROUGHPUT SUMMARY
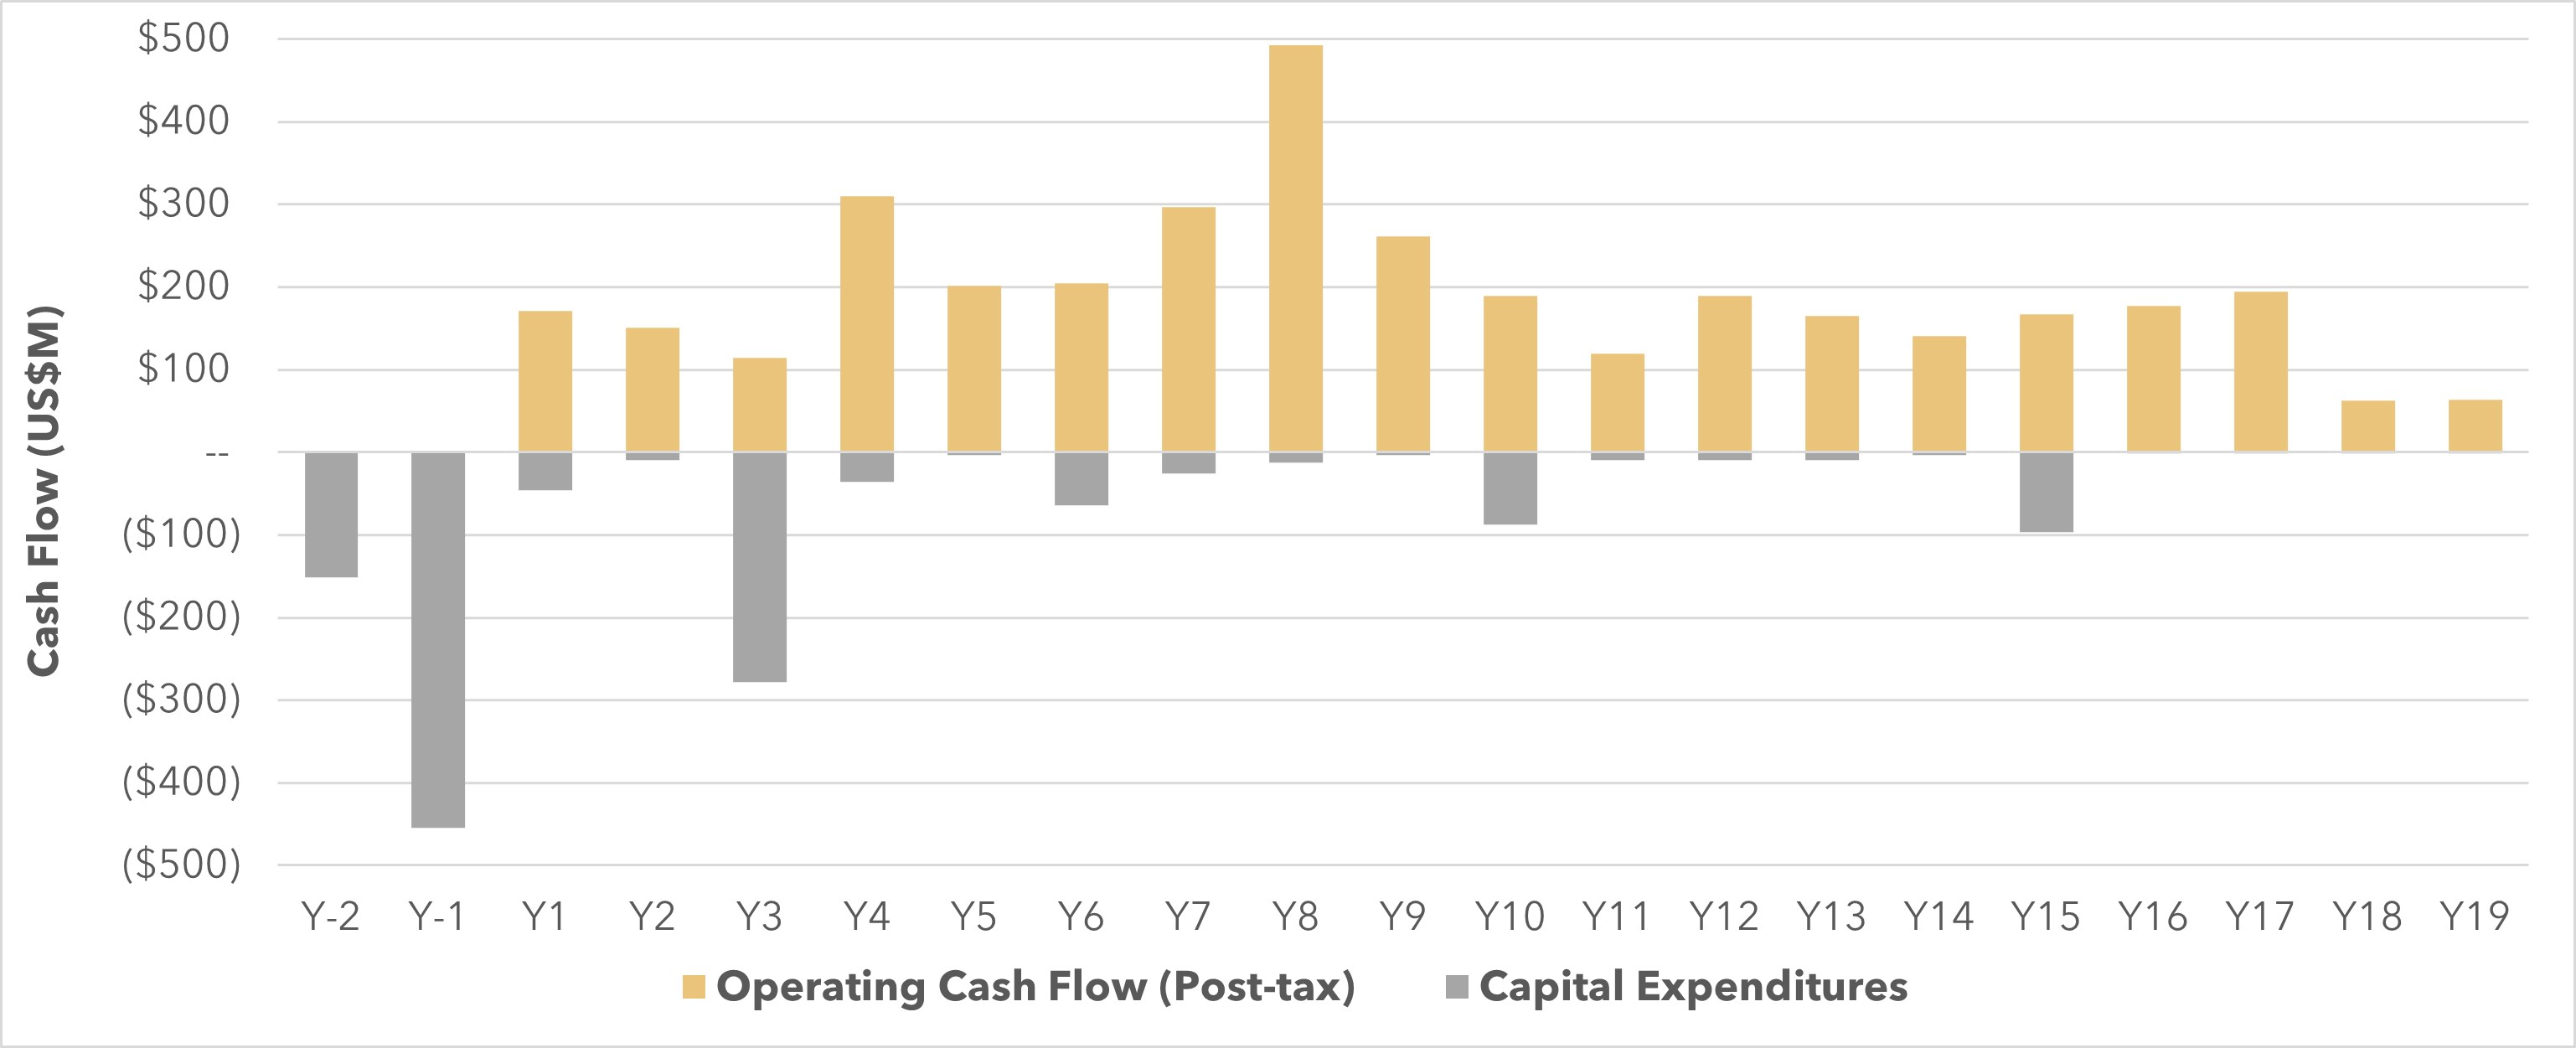
APPENDIX F – AFTER-TAX FREE CASH FLOW
APPENDIX G - SIMPLIFIED PROCESS FLOWSHEETS
PHASE 1 – 26,000 tpd nameplate capacity / PHASE 2 – 51,000 tpd nameplate capacity
APPENDIX H – METALLURGICAL BALANCE SUMMARY
| | UNITS | PHASE 1 | PHASE 2 | LOM | |||||||||||||
| Years 1 - 4 | Years 5 - 12 | Years 13 - 19 | |||||||||||||||
| Ag | Au | Pb | Zn | Ag | Au | Pb | Zn | Ag | Au | Pb | Zn | Ag | Au | Pb | Zn | ||
| MET BALANCE | |||||||||||||||||
| Average head grade | g/t or % | 42 | 0.19 | 0.57 | 0.67 | 30 | 0.07 | 0.44 | 0.86 | 23 | 0.06 | 0.32 | 0.57 | 29 | 0.08 | 0.41 | 0.72 |
| Recovered to Pb Con | % | 83 | 18 | 91 | 5 | 77 | 18 | 88 | 4 | 70 | 18 | 84 | 4 | 77 | 18 | 86 | 5 |
| Recovered to Zn Con | % | 8 | 10 | nm | 85 | 10 | 10 | nm | 86 | 11 | 10 | nm | 85 | 10 | 10 | nm | 85 |
| Tailings | % | 9 | 72 | nm | 10 | 13 | 72 | nm | 10 | 19 | 72 | nm | 11 | 13 | 72 | nm | 10 |
| Total | % | 100 | 100 | 100 | 100 | 100 | 100 | 100 | 100 | 100 | 100 | 100 | 100 | 100 | 100 | 100 | 100 |
| CONCENTRATE GRADES | |||||||||||||||||
| Pb Concentrate | g/t or % | 3,750 | 3.86 | 57 | - | 3,096 | 1.60 | 52 | - | 2,548 | 1.82 | 44 | - | 3,062 | 2.05 | 50 | - |
| Zn Concentrate | g/t or % | 302 | 1.61 | - | 50 | 198 | 0.43 | - | 51 | 273 | 0.59 | - | 50 | 231 | 0.62 | - | 50 |
nm – Pb recovery into the Zn concentrate was not modelled for the purposes of this Study
APPENDIX I - SITE LAYOUT:

APPENDIX J – PRODUCTION & CASH FLOW SCHEDULE:
| Units | Total/Avg | Y-2 | Y-1 | Y1 | Y2 | Y3 | Y4 | Y5 | Y6 | Y7 | Y8 | Y9 | Y10 | Y11 | Y12 | Y13 | Y14 | Y15 | Y16 | Y17 | Y18 | Y19 | Y20 | ||
| MINING | |||||||||||||||||||||||||
| Mineralized Material Mined* | mt | 347 | 2 | 2 | 20 | 22 | 27 | 20 | 19 | 29 | 31 | 31 | 20 | 19 | 16 | 17 | 14 | 18 | 16 | 13 | 9 | -- | -- | -- | |
| Waste Mined | mt | 696 | 5 | 9 | 32 | 42 | 44 | 42 | 43 | 43 | 41 | 41 | 46 | 44 | 46 | 49 | 54 | 51 | 30 | 26 | 8 | -- | -- | -- | |
| Total Material Mined | mt | 1,043 | 7 | 11 | 53 | 65 | 70 | 62 | 62 | 72 | 72 | 72 | 66 | 63 | 62 | 66 | 68 | 69 | 46 | 39 | 17 | -- | -- | -- | |
| Mining Rate | ktpd | 150 | 19 | 30 | 145 | 178 | 192 | 170 | 170 | 197 | 197 | 197 | 181 | 172 | 171 | 182 | 187 | 190 | 125 | 107 | 46 | -- | -- | -- | |
| Strip Ratio | w:o | 2.01 | 3.5 | 4.1 | 1.6 | 1.9 | 1.6 | 2.1 | 2.2 | 1.5 | 1.3 | 1.3 | 2.3 | 2.4 | 2.8 | 2.9 | 3.8 | 2.9 | 1.8 | 2.0 | 0.8 | -- | -- | -- | |
| *Mineralized material mined includes 20Mt of above cutoff oxides that are not processed. For ore processed (ie: reserves), see "Processing" section below | |||||||||||||||||||||||||
| PROCESSING | |||||||||||||||||||||||||
| Oxides – Mill Feed: | |||||||||||||||||||||||||
| Ore Tonnes | mt | 20 | -- | -- | -- | -- | 0.1 | 0.3 | 1.9 | 0.0 | -- | -- | 1.3 | 0.0 | 0.1 | 2.7 | 2.6 | 2.7 | 2.7 | 2.7 | 2.5 | -- | -- | 0.4 | |
| Ore Grades: | |||||||||||||||||||||||||
| Ag | g/t | 43.0 | -- | -- | -- | -- | 50.8 | 64.7 | 46.0 | 46.0 | -- | -- | 44.5 | 32.1 | 48.1 | 42.4 | 42.6 | 42.6 | 42.6 | 42.6 | 42.6 | -- | -- | 22.8 | |
| Au | g/t | 0.08 | -- | -- | -- | -- | 0.09 | 0.06 | 0.09 | 0.09 | -- | -- | 0.09 | 0.16 | 0.03 | 0.08 | 0.08 | 0.08 | 0.08 | 0.08 | 0.08 | -- | -- | 0.07 | |
| Pb | % | 0.37% | -- | -- | -- | -- | 0.68% | 0.63% | 0.34% | 0.34% | -- | -- | 0.60% | 0.44% | 0.19% | 0.36% | 0.36% | 0.36% | 0.36% | 0.36% | 0.36% | -- | -- | 0.20% | |
| Zn | % | 0.40% | -- | -- | -- | -- | 0.93% | 0.53% | 0.34% | 0.34% | -- | -- | 0.68% | 0.73% | 0.41% | 0.39% | 0.38% | 0.38% | 0.38% | 0.38% | 0.38% | -- | -- | 0.24% | |
| AgEq | g/t | 76 | -- | -- | -- | -- | 113 | 109 | 76 | 75 | -- | -- | 95 | 85 | 72 | 74 | 74 | 74 | 74 | 74 | 74 | -- | -- | 43 | |
| Sulphides – Mill Feed: | |||||||||||||||||||||||||
| Ore Tonnes | mt | 307 | -- | -- | 9 | 10 | 9 | 17 | 17 | 19 | 19 | 19 | 18 | 18 | 18 | 16 | 16 | 16 | 16 | 16 | 16 | 18 | 18 | 2 | |
| Mill Head Grade: | |||||||||||||||||||||||||
| Ag | g/t | 27.7 | -- | -- | 44.8 | 44.3 | 38.9 | 39.9 | 31.7 | 28.1 | 31.4 | 41.7 | 27.0 | 25.2 | 23.1 | 27.0 | 24.8 | 24.3 | 25.4 | 23.6 | 22.1 | 12.6 | 12.6 | 12.6 | |
| Au | g/t | 0.08 | -- | -- | 0.19 | 0.25 | 0.15 | 0.19 | 0.10 | 0.06 | 0.07 | 0.08 | 0.06 | 0.05 | 0.05 | 0.06 | 0.05 | 0.06 | 0.06 | 0.06 | 0.05 | 0.05 | 0.05 | 0.05 | |
| Pb | % | 0.41% | -- | -- | 0.59% | 0.61% | 0.54% | 0.56% | 0.39% | 0.36% | 0.48% | 0.73% | 0.48% | 0.40% | 0.28% | 0.42% | 0.43% | 0.38% | 0.36% | 0.38% | 0.40% | 0.16% | 0.16% | 0.16% | |
| Zn | % | 0.74% | -- | -- | 0.73% | 0.61% | 0.73% | 0.65% | 0.61% | 0.75% | 0.92% | 1.29% | 0.99% | 0.77% | 0.74% | 0.89% | 0.80% | 0.69% | 0.66% | 0.75% | 0.69% | 0.35% | 0.35% | 0.35% | |
| AgEq | g/t | 74 | -- | -- | 105 | 104 | 94 | 96 | 74 | 71 | 86 | 118 | 83 | 70 | 63 | 78 | 72 | 67 | 66 | 68 | 64 | 34 | 34 | 34 | |
| TOTAL ORE - Mill Feed: | |||||||||||||||||||||||||
| Ore Tonnes | mt | 327 | -- | -- | 9 | 10 | 9 | 18 | 18 | 19 | 19 | 19 | 19 | 18 | 18 | 19 | 18 | 19 | 19 | 19 | 19 | 18 | 18 | 3 | |
| Mill Head Grade: | |||||||||||||||||||||||||
| Ag | g/t | 29 | -- | -- | 45 | 44 | 39 | 40 | 33 | 28 | 31 | 42 | 28 | 25 | 23 | 29 | 27 | 27 | 28 | 26 | 25 | 13 | 13 | 14 | |
| Au | g/t | 0.08 | -- | -- | 0.19 | 0.25 | 0.15 | 0.19 | 0.10 | 0.06 | 0.07 | 0.08 | 0.06 | 0.05 | 0.05 | 0.06 | 0.05 | 0.06 | 0.06 | 0.06 | 0.05 | 0.05 | 0.05 | 0.05 | |
| Pb | % | 0.41% | -- | -- | 0.59% | 0.61% | 0.55% | 0.56% | 0.38% | 0.36% | 0.48% | 0.73% | 0.49% | 0.40% | 0.28% | 0.41% | 0.42% | 0.38% | 0.36% | 0.38% | 0.39% | 0.16% | 0.16% | 0.16% | |
| Zn | % | 0.72% | -- | -- | 0.73% | 0.61% | 0.73% | 0.65% | 0.59% | 0.01 | 0.92% | 1.29% | 0.97% | 0.01 | 0.74% | 0.82% | 0.74% | 0.65% | 0.62% | 0.70% | 0.65% | 0.35% | 0.35% | 0.33% | |
| AgEq | g/t | 74 | -- | -- | 105 | 104 | 94 | 96 | 74 | 71 | 86 | 118 | 84 | 70 | 63 | 77 | 72 | 68 | 67 | 69 | 65 | 34 | 34 | 35 | |
| Lead/Silver Conc. – Recovery: | |||||||||||||||||||||||||
| Ag | % | 77% | -- | -- | 83% | 84% | 82% | 82% | 74% | 75% | 80% | 86% | 78% | 77% | 71% | 73% | 73% | 72% | 71% | 72% | 72% | 58% | 58% | 58% | |
| Au | % | 18% | -- | -- | 18% | 18% | 18% | 18% | 18% | 18% | 18% | 18% | 18% | 18% | 18% | 18% | 18% | 18% | 18% | 18% | 18% | 18% | 18% | 18% | |
| Pb | % | 86% | -- | -- | 92% | 92% | 90% | 90% | 84% | 88% | 90% | 93% | 86% | 89% | 85% | 83% | 83% | 81% | 81% | 81% | 83% | 77% | 77% | 70% | |
| Zinc Conc. – Recovery: | |||||||||||||||||||||||||
| Ag | % | 10% | -- | -- | 8% | 8% | 9% | 8% | 10% | 10% | 9% | 7% | 9% | 10% | 12% | 10% | 10% | 11% | 11% | 11% | 10% | 15% | 15% | 14% | |
| Au | % | 10% | -- | -- | 10% | 10% | 10% | 10% | 10% | 10% | 10% | 10% | 10% | 10% | 10% | 10% | 10% | 10% | 10% | 10% | 10% | 10% | 10% | 10% | |
| Zn | % | 85% | -- | -- | 85% | 84% | 85% | 84% | 84% | 85% | 86% | 87% | 86% | 85% | 85% | 86% | 85% | 85% | 84% | 85% | 85% | 78% | 78% | 79% | |
| PRODUCTION PROFILE | Units | Total/Avg | Y-2 | Y-1 | Y1 | Y2 | Y3 | Y4 | Y5 | Y6 | Y7 | Y8 | Y9 | Y10 | Y11 | Y12 | Y13 | Y14 | Y15 | Y16 | Y17 | Y18 | Y19 | Y20 | |
| METAL PRODUCED: | |||||||||||||||||||||||||
| Ag – Ag/Pb Concentrate | moz | 229 | -- | -- | 10 | 11 | 10 | 19 | 14 | 13 | 16 | 22 | 13 | 11 | 10 | 13 | 12 | 12 | 12 | 11 | 11 | 4 | 4 | 1 | |
| Au – Ag/Pb Concentrate | koz | 153 | -- | -- | 10 | 14 | 8 | 20 | 10 | 7 | 8 | 9 | 7 | 5 | 5 | 7 | 6 | 7 | 7 | 7 | 6 | 5 | 5 | 1 | |
| Pb – Ag/Pb Concentrate | mlbs | 2,581 | -- | -- | 104 | 118 | 102 | 197 | 131 | 128 | 182 | 286 | 175 | 143 | 96 | 137 | 139 | 126 | 121 | 126 | 133 | 63 | 63 | 9 | |
| AgEq – Ag/Pb Concentrate | moz | 358 | -- | -- | 16 | 18 | 15 | 29 | 21 | 19 | 24 | 36 | 22 | 18 | 14 | 20 | 18 | 18 | 18 | 18 | 17 | 8 | 8 | 1 | |
| Ag – Zn Concentrate | moz | 30 | -- | -- | 1 | 1 | 1 | 2 | 2 | 2 | 2 | 2 | 2 | 1 | 2 | 2 | 2 | 2 | 2 | 2 | 2 | 1 | 1 | 0 | |
| Au – Zn Concentrate | koz | 80 | -- | -- | 5 | 7 | 4 | 10 | 5 | 3 | 4 | 5 | 4 | 3 | 3 | 4 | 3 | 4 | 4 | 4 | 3 | 3 | 3 | 0 | |
| Zn – Zn Concentrate | mlbs | 4,437 | -- | -- | 118 | 110 | 130 | 217 | 203 | 259 | 335 | 480 | 351 | 264 | 252 | 287 | 253 | 226 | 221 | 245 | 228 | 122 | 122 | 17 | |
| AgEq – Zn Concentrate | moz | 277 | -- | -- | 8 | 8 | 8 | 15 | 13 | 16 | 20 | 28 | 21 | 16 | 16 | 18 | 16 | 14 | 14 | 15 | 14 | 8 | 8 | 1 | |
| Ag – Total | moz | 259 | -- | -- | 11 | 13 | 11 | 21 | 17 | 14 | 17 | 24 | 15 | 13 | 11 | 15 | 13 | 13 | 14 | 13 | 12 | 5 | 5 | 1 | |
| Au – Total | koz | 233 | -- | -- | 15 | 21 | 12 | 30 | 16 | 10 | 12 | 13 | 10 | 8 | 8 | 10 | 9 | 11 | 11 | 10 | 9 | 8 | 8 | 1 | |
| Pb – Total | mlbs | 2,581 | -- | -- | 104 | 118 | 102 | 197 | 131 | 128 | 182 | 286 | 175 | 143 | 96 | 137 | 139 | 126 | 121 | 126 | 133 | 63 | 63 | 9 | |
| Zn – Total | mlbs | 4,437 | -- | -- | 118 | 110 | 130 | 217 | 203 | 259 | 335 | 480 | 351 | 264 | 252 | 287 | 253 | 226 | 221 | 245 | 228 | 122 | 122 | 17 | |
| AgEq – Total Metal Produced | moz | 635 | -- | -- | 24 | 25 | 23 | 44 | 35 | 35 | 45 | 64 | 43 | 34 | 30 | 37 | 34 | 32 | 32 | 33 | 33 | 16 | 16 | 2 | |
| METAL PAYABLE: | |||||||||||||||||||||||||
| Ag – Ag/Pb Concentrate | moz | 218 | -- | -- | 10 | 11 | 9 | 18 | 14 | 12 | 15 | 21 | 13 | 11 | 9 | 12 | 11 | 11 | 11 | 11 | 10 | 4 | 4 | 1 | |
| Au – Ag/Pb Concentrate | koz | 78 | -- | -- | 7 | 11 | 6 | 15 | 6 | 3 | 3 | 2 | 2 | 1 | 2 | 3 | 2 | 3 | 3 | 3 | 2 | 3 | 3 | 0 | |
| Pb – Ag/Pb Concentrate | mlbs | 2,427 | -- | -- | 98 | 112 | 97 | 187 | 122 | 120 | 172 | 272 | 165 | 135 | 90 | 129 | 130 | 118 | 113 | 118 | 125 | 58 | 58 | 9 | |
| AgEq – Ag/Pb Concentrate | moz | 334 | -- | -- | 15 | 17 | 14 | 27 | 20 | 18 | 23 | 34 | 20 | 17 | 13 | 18 | 17 | 17 | 17 | 16 | 16 | 7 | 7 | 1 | |
| Ag – Zn Concentrate | moz | 12 | -- | -- | 0 | 1 | 0 | 1 | 1 | 1 | 1 | 0 | 0 | 1 | 1 | 1 | 1 | 1 | 1 | 1 | 1 | 1 | 1 | 0 | |
| Au – Zn Concentrate | koz | 7 | -- | -- | 1 | 3 | 0 | 3 | -- | -- | -- | -- | -- | -- | -- | -- | -- | -- | -- | -- | -- | -- | -- | -- | |
| Zn – Zn Concentrate | mlbs | 3,733 | -- | -- | 99 | 92 | 109 | 182 | 170 | 218 | 282 | 406 | 296 | 222 | 212 | 242 | 213 | 190 | 185 | 206 | 191 | 102 | 102 | 14 | |
| AgEq – Zn Concentrate | moz | 217 | -- | -- | 6 | 6 | 6 | 11 | 10 | 13 | 16 | 23 | 17 | 13 | 12 | 14 | 12 | 11 | 11 | 12 | 11 | 6 | 6 | 1 | |
| Ag – Total | moz | 230 | -- | -- | 10 | 11 | 10 | 19 | 15 | 13 | 15 | 21 | 13 | 11 | 10 | 13 | 12 | 12 | 12 | 12 | 11 | 5 | 5 | 1 | |
| Au – Total | koz | 86 | -- | -- | 8 | 14 | 6 | 17 | 6 | 3 | 3 | 2 | 2 | 1 | 2 | 3 | 2 | 3 | 3 | 3 | 2 | 3 | 3 | 0 | |
| Pb – Total | mlbs | 2,427 | -- | -- | 98 | 112 | 97 | 187 | 122 | 120 | 172 | 272 | 165 | 135 | 90 | 129 | 130 | 118 | 113 | 118 | 125 | 58 | 58 | 9 | |
| Zn – Total | mlbs | 3,733 | -- | -- | 99 | 92 | 109 | 182 | 170 | 218 | 282 | 406 | 296 | 222 | 212 | 242 | 213 | 190 | 185 | 206 | 191 | 102 | 102 | 14 | |
| AgEq – Total Metal Payable | moz | 550 | -- | -- | 21 | 23 | 20 | 39 | 30 | 30 | 39 | 56 | 37 | 30 | 26 | 32 | 29 | 28 | 28 | 28 | 27 | 13 | 13 | 2 | |
| REVENUE | Units | Total/Avg | Y-2 | Y-1 | Y1 | Y2 | Y3 | Y4 | Y5 | Y6 | Y7 | Y8 | Y9 | Y10 | Y11 | Y12 | Y13 | Y14 | Y15 | Y16 | Y17 | Y18 | Y19 | Y20 | |
| OXIDES + SULPHIDES: | |||||||||||||||||||||||||
| Ag Revenue | US$mm | $5,065 | -- | -- | $228 | $251 | $212 | $415 | $325 | $280 | $337 | $472 | $289 | $251 | $216 | $283 | $261 | $259 | $271 | $253 | $240 | $102 | $102 | $16 | |
| Au Revenue | US$mm | $137 | -- | -- | $14 | $22 | $9 | $28 | $10 | $4 | $5 | $3 | $3 | $2 | $3 | $4 | $2 | $5 | $5 | $4 | $3 | $5 | $5 | $1 | |
| Pb Revenue | US$mm | $2,427 | -- | -- | $98 | $112 | $97 | $187 | $122 | $120 | $172 | $272 | $165 | $135 | $90 | $129 | $130 | $118 | $113 | $118 | $125 | $58 | $58 | $9 | |
| Zn Revenue | US$mm | $4,480 | -- | -- | $119 | $111 | $131 | $218 | $204 | $261 | $338 | $487 | $355 | $266 | $254 | $290 | $256 | $228 | $222 | $247 | $230 | $123 | $123 | $17 | |
| Gross Revenue | US$mm | $12,109 | -- | -- | $458 | $496 | $449 | $847 | $663 | $665 | $853 | $1,234 | $812 | $653 | $562 | $706 | $648 | $609 | $612 | $623 | $597 | $288 | $288 | $43 | |
| Treatment & Refining Charges | US$mm | $1,296 | -- | -- | $41 | $42 | $43 | $77 | $66 | $73 | $93 | $131 | $93 | $74 | $67 | $79 | $73 | $67 | $66 | $70 | $67 | $35 | $35 | $5 | |
| Total Penalties | US$mm | $43 | -- | -- | $1 | $1 | $1 | $2 | $2 | $2 | $3 | $5 | $4 | $3 | $2 | $3 | $2 | $2 | $2 | $2 | $2 | $1 | $1 | $0 | |
| Net Revenue - Total | US$mm | $10,769 | -- | -- | $416 | $453 | $405 | $769 | $595 | $590 | $756 | $1,098 | $715 | $577 | $493 | $624 | $573 | $540 | $543 | $551 | $528 | $252 | $252 | $38 | |
| OPERATING COSTS | |||||||||||||||||||||||||
| UNIT COSTS: | |||||||||||||||||||||||||
| Mine (Incl. Rehandling) | US$/t Moved | $2.35 | -- | -- | $2.42 | $2.33 | $2.36 | $2.55 | $2.48 | $1.95 | $2.03 | $2.17 | $2.20 | $2.19 | $2.28 | $2.29 | $2.15 | $2.21 | $2.65 | $2.81 | $3.72 | $0.97 | $0.82 | $1.12 | |
| Processing | US$/t Processed | $6.28 | -- | -- | $6.87 | $6.72 | $6.90 | $6.13 | $6.25 | $6.21 | $6.14 | $6.17 | $6.20 | $6.30 | $6.30 | $6.26 | $6.27 | $6.25 | $6.20 | $6.23 | $6.24 | $6.28 | $6.28 | $6.28 | |
| Site G&A Costs | US$/t Processed | $0.59 | -- | -- | $1.18 | $1.07 | $1.08 | $0.56 | $0.54 | $0.54 | $0.52 | $0.52 | $0.53 | $0.55 | $0.55 | $0.54 | $0.55 | $0.54 | $0.53 | $0.54 | $0.54 | $0.55 | $0.55 | $0.55 | |
| OPERATING COSTS INCURED: | |||||||||||||||||||||||||
| Mine (Incl. Rehandling) | US$mm | $2,406 | -- | -- | $128 | $151 | $166 | $158 | $154 | $140 | $146 | $156 | $145 | $138 | $142 | $152 | $146 | $153 | $121 | $110 | $62 | $18 | $15 | $3 | |
| Processing | US$mm | $2,056 | -- | -- | $59 | $64 | $65 | $109 | $115 | $115 | $118 | $119 | $117 | $115 | $115 | $116 | $114 | $116 | $117 | $116 | $116 | $115 | $115 | $17 | |
| Site G&A Costs | US$mm | $192 | -- | -- | $10 | $10 | $10 | $10 | $10 | $10 | $10 | $10 | $10 | $10 | $10 | $10 | $10 | $10 | $10 | $10 | $10 | $10 | $10 | $1 | |
| Total Site Operating Costs | US$mm | $4,655 | -- | -- | $198 | $226 | $241 | $277 | $279 | $266 | $274 | $285 | $273 | $263 | $267 | $278 | $270 | $279 | $249 | $236 | $188 | $143 | $140 | $21 | |
| NSR - Government | US$mm | $25 | -- | -- | $1 | $1 | $1 | $2 | $2 | $1 | $2 | $2 | $1 | $1 | $1 | $1 | $1 | $1 | $1 | $1 | $1 | $1 | $1 | $0 | |
| Concentrate Transport | US$mm | $1,043 | -- | -- | $32 | $33 | $34 | $60 | $51 | $58 | $74 | $104 | $76 | $60 | $53 | $64 | $59 | $55 | $53 | $57 | $56 | $30 | $30 | $4 | |
| Total Operating Costs | US$mm | $5,722 | -- | -- | $230 | $260 | $276 | $339 | $332 | $325 | $350 | $391 | $350 | $325 | $322 | $343 | $331 | $335 | $304 | $295 | $245 | $174 | $171 | $26 | |
| CASH COSTS: | |||||||||||||||||||||||||
| Co-Product Basis: | |||||||||||||||||||||||||
| Operating Cash Costs | US$/oz AgEq | $8.46 | -- | -- | $9.49 | $10.02 | $11.81 | $7.18 | $9.27 | $8.78 | $7.08 | $5.07 | $7.38 | $8.87 | $10.46 | $8.67 | $9.17 | $10.08 | $8.95 | $8.34 | $6.94 | $10.92 | $10.72 | $10.89 | |
| Total Cash Costs | US$/oz AgEq | $12.83 | -- | -- | $13.10 | $13.44 | $15.66 | $10.84 | $13.27 | $13.25 | $11.51 | $9.38 | $12.10 | $13.51 | $15.30 | $13.25 | $13.77 | $14.59 | $13.38 | $12.97 | $11.58 | $16.01 | $15.81 | $15.82 | |
| All-in Sustaining Costs | US$/oz AgEq | $13.47 | -- | -- | $13.49 | $13.84 | $16.45 | $11.01 | $13.39 | $15.38 | $11.73 | $9.60 | $12.19 | $16.46 | $15.68 | $13.54 | $14.07 | $14.70 | $16.86 | $13.00 | $11.62 | $16.08 | $15.84 | $16.02 | |
| CAPITAL EXPENDITURES | Units | Total/Avg | Y-2 | Y-1 | Y1 | Y2 | Y3 | Y4 | Y5 | Y6 | Y7 | Y8 | Y9 | Y10 | Y11 | Y12 | Y13 | Y14 | Y15 | Y16 | Y17 | Y18 | Y19 | Y20 | |
| Initial/Expansion Capex | US$mm | $914 | $151 | $454 | -- | -- | $262 | $29 | -- | -- | $17 | -- | -- | -- | -- | -- | -- | -- | -- | -- | -- | -- | -- | ||
| Sustaining Capex (incl. Net Closure) | US$mm | $463 | -- | -- | $46 | $9 | $16 | $6 | $3 | $64 | $9 | $12 | $3 | $88 | $10 | $9 | $9 | $3 | $97 | $1 | $1 | $1 | -- | -- | |
| Total Capital Expenditures | US$mm | $1,377 | $151 | $454 | $46 | $9 | $278 | $35 | $3 | $64 | $26 | $12 | $3 | $88 | $10 | $9 | $9 | $3 | $97 | $1 | $1 | $1 | $0 | $75 | |
| FREE CASH FLOW VALUATION | |||||||||||||||||||||||||
| Net Revenue | US$mm | $10,769 | -- | -- | $416 | $453 | $405 | $769 | $595 | $590 | $756 | $1,098 | $715 | $577 | $493 | $624 | $573 | $540 | $543 | $551 | $528 | $252 | $252 | $38 | |
| Operating Expenses | US$mm | ($4,655) | -- | -- | ($198) | ($226) | ($241) | ($277) | ($279) | ($266) | ($274) | ($285) | ($273) | ($263) | ($267) | ($278) | ($270) | ($279) | ($249) | ($236) | ($188) | ($143) | ($140) | ($21) | |
| Concentrate Transportation | US$mm | ($1,043) | -- | -- | ($32) | ($33) | ($34) | ($60) | ($51) | ($58) | ($74) | ($104) | ($76) | ($60) | ($53) | ($64) | ($59) | ($55) | ($53) | ($57) | ($56) | ($30) | ($30) | ($4) | |
| Royalties | US$mm | ($25) | -- | -- | ($1) | ($1) | ($1) | ($2) | ($2) | ($1) | ($2) | ($2) | ($1) | ($1) | ($1) | ($1) | ($1) | ($1) | ($1) | ($1) | ($1) | ($1) | ($1) | ($0) | |
| EBITDA | US$mm | $5,047 | -- | -- | $185 | $193 | $129 | $430 | $263 | $265 | $406 | $708 | $365 | $252 | $171 | $281 | $243 | $205 | $240 | $256 | $283 | $78 | $81 | $12 | |
| Capital Expenditures | US$mm | ($1,377) | ($151) | ($454) | ($46) | ($9) | ($278) | ($35) | ($3) | ($64) | ($26) | ($12) | ($3) | ($88) | ($10) | ($9) | ($9) | ($3) | ($97) | ($1) | ($1) | ($1) | ($0) | ($75) | |
| Pre-Tax Free Cash Flow | US$mm | $3,670 | ($151) | ($454) | $140 | $184 | ($149) | $394 | $259 | $200 | $381 | $695 | $362 | $164 | $162 | $271 | $234 | $202 | $143 | $255 | $282 | $77 | $81 | ($63) | |
| Mining Tax | US$mm | ($379) | -- | -- | ($14) | ($14) | ($10) | ($32) | ($20) | ($20) | ($30) | ($53) | ($27) | ($19) | ($13) | ($21) | ($18) | ($15) | ($18) | ($19) | ($21) | ($6) | ($6) | ($1) | |
| Income Tax Payable | US$mm | ($986) | -- | -- | -- | ($28) | ($6) | ($88) | ($41) | ($41) | ($79) | ($162) | ($77) | ($43) | ($39) | ($70) | ($59) | ($49) | ($55) | ($59) | ($67) | ($10) | ($11) | -- | |
| Post-Tax Free Cash Flow | US$mm | $2,305 | ($151) | ($454) | $126 | $141 | ($164) | $274 | $198 | $140 | $271 | $480 | $258 | $102 | $110 | $180 | $156 | $138 | $70 | $176 | $194 | $61 | $64 | ($64) | |
| Rolling EOP After-tax NPV (5%) | US$B | $1.4 | $2.0 | $1.9 | $1.9 | $2.2 | $2.0 | $1.9 | $1.8 | $1.6 | $1.2 | $1.0 | $0.9 | $0.9 | $0.7 | $0.6 | $0.5 | $0.4 | $0.3 | $0.1 | $0.0 | ||||
| Pre-Tax | Post-Tax | ||||||||||||||||||||||||
| NPV (5%) | US$mm | 1,980 | 1,177 | ||||||||||||||||||||||
| IRR | % | 29.4 | 22.0 | ||||||||||||||||||||||
| Payback | Years | 4.1 | 5.2 | ||||||||||||||||||||||
Photos accompanying this announcement are available at
https://www.globenewswire.com/NewsRoom/AttachmentNg/d5f635b7-e690-4cff-bac0-3aae74b22efc
https://www.globenewswire.com/NewsRoom/AttachmentNg/0682ae91-7c30-4f11-8a9f-f05b3cadb44f
https://www.globenewswire.com/NewsRoom/AttachmentNg/0f358248-86e3-46e0-9284-3af4e82a1c24
https://www.globenewswire.com/NewsRoom/AttachmentNg/247ee6c1-d107-4088-9969-a1f4cced5fa1
https://www.globenewswire.com/NewsRoom/AttachmentNg/5b17c523-e1c3-4294-b1e7-76b9c75c0ffd
https://www.globenewswire.com/NewsRoom/AttachmentNg/89966b6a-25e4-4e59-921b-bba2b5d17a59

![]()
LOM Production & AISC
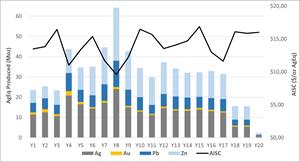
LOM Production & AISC
APPENDIX D
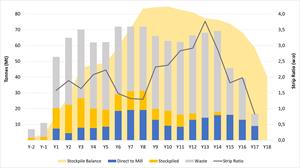
LOM MINE PLAN SUMMARY
APPENDIX E
LOM PROCESS THROUGHPUT SUMMARY
APPENDIX F
AFTER-TAX FREE CASH FLOW
APPENDIX G
SIMPLIFIED PROCESS FLOWSHEETS
APPENDIX I